Immigrants from Congo vs Dominican 3rd Grade
COMPARE
Immigrants from Congo
Dominican
3rd Grade
3rd Grade Comparison
Immigrants from Congo
Dominicans
97.3%
3RD GRADE
0.6/ 100
METRIC RATING
256th/ 347
METRIC RANK
96.4%
3RD GRADE
0.0/ 100
METRIC RATING
324th/ 347
METRIC RANK
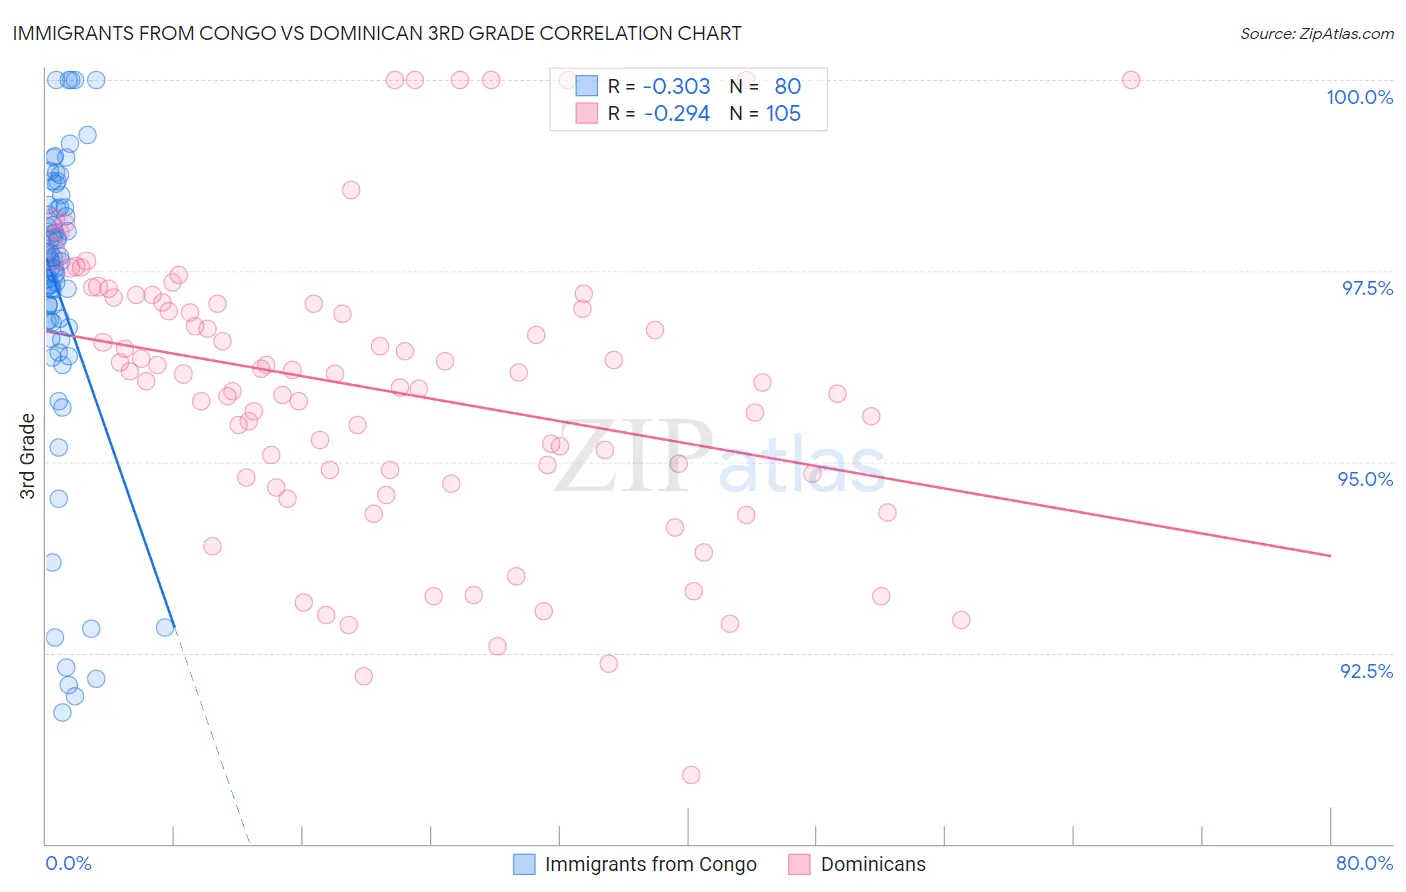
Immigrants from Congo vs Dominican 3rd Grade Correlation Chart
The statistical analysis conducted on geographies consisting of 92,124,753 people shows a mild negative correlation between the proportion of Immigrants from Congo and percentage of population with at least 3rd grade education in the United States with a correlation coefficient (R) of -0.303 and weighted average of 97.3%. Similarly, the statistical analysis conducted on geographies consisting of 355,142,603 people shows a weak negative correlation between the proportion of Dominicans and percentage of population with at least 3rd grade education in the United States with a correlation coefficient (R) of -0.294 and weighted average of 96.4%, a difference of 0.96%.
3rd Grade Correlation Summary
| Measurement | Immigrants from Congo | Dominican |
| Minimum | 91.7% | 90.9% |
| Maximum | 100.0% | 100.0% |
| Range | 8.3% | 9.1% |
| Mean | 97.2% | 95.9% |
| Median | 97.6% | 96.1% |
| Interquartile 25% (IQ1) | 96.8% | 94.8% |
| Interquartile 75% (IQ3) | 98.3% | 97.1% |
| Interquartile Range (IQR) | 1.5% | 2.3% |
| Standard Deviation (Sample) | 2.0% | 1.9% |
| Standard Deviation (Population) | 2.0% | 1.9% |
Similar Demographics by 3rd Grade
Demographics Similar to Immigrants from Congo by 3rd Grade
In terms of 3rd grade, the demographic groups most similar to Immigrants from Congo are Bolivian (97.3%, a difference of 0.0%), Immigrants from Colombia (97.3%, a difference of 0.010%), Jamaican (97.4%, a difference of 0.020%), Immigrants from Liberia (97.3%, a difference of 0.020%), and Armenian (97.3%, a difference of 0.020%).
| Demographics | Rating | Rank | 3rd Grade |
| South Americans | 0.9 /100 | #249 | Tragic 97.4% |
| Immigrants | Middle Africa | 0.9 /100 | #250 | Tragic 97.4% |
| Immigrants | Asia | 0.8 /100 | #251 | Tragic 97.4% |
| Peruvians | 0.8 /100 | #252 | Tragic 97.4% |
| Immigrants | Africa | 0.8 /100 | #253 | Tragic 97.4% |
| Jamaicans | 0.7 /100 | #254 | Tragic 97.4% |
| Bolivians | 0.6 /100 | #255 | Tragic 97.3% |
| Immigrants | Congo | 0.6 /100 | #256 | Tragic 97.3% |
| Immigrants | Colombia | 0.5 /100 | #257 | Tragic 97.3% |
| Immigrants | Liberia | 0.5 /100 | #258 | Tragic 97.3% |
| Armenians | 0.4 /100 | #259 | Tragic 97.3% |
| Immigrants | Ethiopia | 0.4 /100 | #260 | Tragic 97.3% |
| Immigrants | South America | 0.4 /100 | #261 | Tragic 97.3% |
| Immigrants | Sierra Leone | 0.4 /100 | #262 | Tragic 97.3% |
| Taiwanese | 0.3 /100 | #263 | Tragic 97.3% |
Demographics Similar to Dominicans by 3rd Grade
In terms of 3rd grade, the demographic groups most similar to Dominicans are Mexican American Indian (96.4%, a difference of 0.010%), Immigrants from Vietnam (96.4%, a difference of 0.050%), Japanese (96.4%, a difference of 0.060%), Bangladeshi (96.3%, a difference of 0.060%), and Honduran (96.5%, a difference of 0.080%).
| Demographics | Rating | Rank | 3rd Grade |
| Immigrants | Bangladesh | 0.0 /100 | #317 | Tragic 96.6% |
| Hispanics or Latinos | 0.0 /100 | #318 | Tragic 96.5% |
| Vietnamese | 0.0 /100 | #319 | Tragic 96.5% |
| Immigrants | Nicaragua | 0.0 /100 | #320 | Tragic 96.5% |
| Indonesians | 0.0 /100 | #321 | Tragic 96.5% |
| Immigrants | Belize | 0.0 /100 | #322 | Tragic 96.5% |
| Hondurans | 0.0 /100 | #323 | Tragic 96.5% |
| Dominicans | 0.0 /100 | #324 | Tragic 96.4% |
| Mexican American Indians | 0.0 /100 | #325 | Tragic 96.4% |
| Immigrants | Vietnam | 0.0 /100 | #326 | Tragic 96.4% |
| Japanese | 0.0 /100 | #327 | Tragic 96.4% |
| Bangladeshis | 0.0 /100 | #328 | Tragic 96.3% |
| Immigrants | Honduras | 0.0 /100 | #329 | Tragic 96.3% |
| Immigrants | Armenia | 0.0 /100 | #330 | Tragic 96.3% |
| Immigrants | Latin America | 0.0 /100 | #331 | Tragic 96.2% |