Immigrants from Congo vs Kiowa Unemployment Among Youth under 25 years
COMPARE
Immigrants from Congo
Kiowa
Unemployment Among Youth under 25 years
Unemployment Among Youth under 25 years Comparison
Immigrants from Congo
Kiowa
10.9%
UNEMPLOYMENT AMONG YOUTH UNDER 25 YEARS
99.8/ 100
METRIC RATING
38th/ 347
METRIC RANK
12.7%
UNEMPLOYMENT AMONG YOUTH UNDER 25 YEARS
0.0/ 100
METRIC RATING
269th/ 347
METRIC RANK
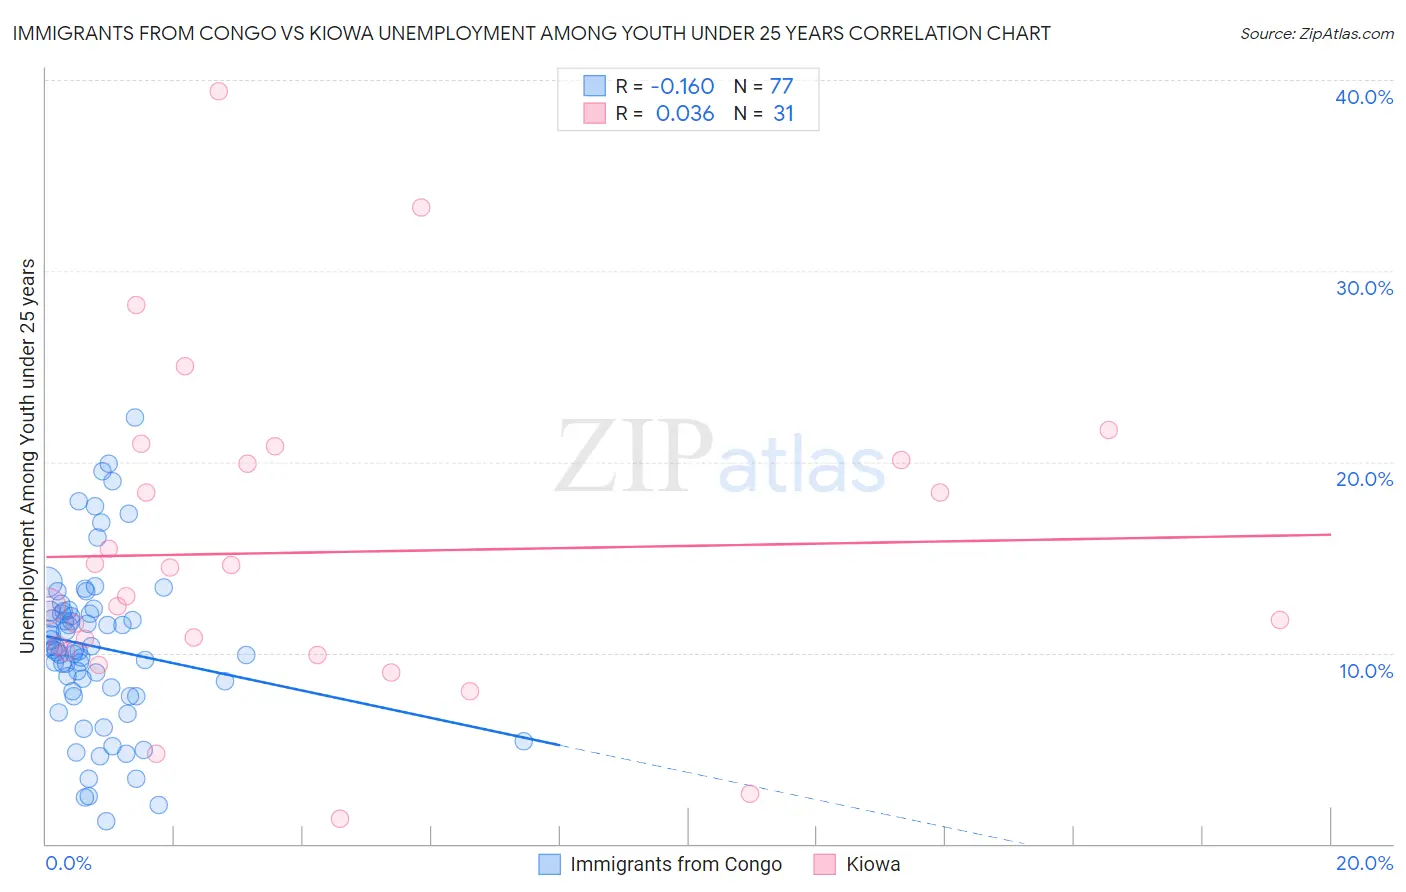
Immigrants from Congo vs Kiowa Unemployment Among Youth under 25 years Correlation Chart
The statistical analysis conducted on geographies consisting of 91,969,114 people shows a poor negative correlation between the proportion of Immigrants from Congo and unemployment rate among youth under the age of 25 in the United States with a correlation coefficient (R) of -0.160 and weighted average of 10.9%. Similarly, the statistical analysis conducted on geographies consisting of 55,922,493 people shows no correlation between the proportion of Kiowa and unemployment rate among youth under the age of 25 in the United States with a correlation coefficient (R) of 0.036 and weighted average of 12.7%, a difference of 16.7%.
Unemployment Among Youth under 25 years Correlation Summary
| Measurement | Immigrants from Congo | Kiowa |
| Minimum | 1.2% | 1.3% |
| Maximum | 22.3% | 39.4% |
| Range | 21.1% | 38.1% |
| Mean | 10.3% | 15.3% |
| Median | 10.2% | 12.9% |
| Interquartile 25% (IQ1) | 7.8% | 10.1% |
| Interquartile 75% (IQ3) | 12.2% | 20.1% |
| Interquartile Range (IQR) | 4.3% | 10.0% |
| Standard Deviation (Sample) | 4.3% | 8.4% |
| Standard Deviation (Population) | 4.2% | 8.2% |
Similar Demographics by Unemployment Among Youth under 25 years
Demographics Similar to Immigrants from Congo by Unemployment Among Youth under 25 years
In terms of unemployment among youth under 25 years, the demographic groups most similar to Immigrants from Congo are Immigrants from Zaire (10.9%, a difference of 0.010%), Immigrants from Zimbabwe (10.8%, a difference of 0.070%), Scottish (10.9%, a difference of 0.17%), Hmong (10.8%, a difference of 0.23%), and Croatian (10.9%, a difference of 0.27%).
| Demographics | Rating | Rank | Unemployment Among Youth under 25 years |
| Slovenes | 99.9 /100 | #31 | Exceptional 10.7% |
| Taiwanese | 99.9 /100 | #32 | Exceptional 10.8% |
| Europeans | 99.9 /100 | #33 | Exceptional 10.8% |
| English | 99.9 /100 | #34 | Exceptional 10.8% |
| Immigrants | Nepal | 99.9 /100 | #35 | Exceptional 10.8% |
| Hmong | 99.8 /100 | #36 | Exceptional 10.8% |
| Immigrants | Zimbabwe | 99.8 /100 | #37 | Exceptional 10.8% |
| Immigrants | Congo | 99.8 /100 | #38 | Exceptional 10.9% |
| Immigrants | Zaire | 99.8 /100 | #39 | Exceptional 10.9% |
| Scottish | 99.8 /100 | #40 | Exceptional 10.9% |
| Croatians | 99.8 /100 | #41 | Exceptional 10.9% |
| Cambodians | 99.7 /100 | #42 | Exceptional 10.9% |
| British | 99.7 /100 | #43 | Exceptional 10.9% |
| Welsh | 99.7 /100 | #44 | Exceptional 10.9% |
| Bulgarians | 99.6 /100 | #45 | Exceptional 10.9% |
Demographics Similar to Kiowa by Unemployment Among Youth under 25 years
In terms of unemployment among youth under 25 years, the demographic groups most similar to Kiowa are Tlingit-Haida (12.7%, a difference of 0.12%), Subsaharan African (12.6%, a difference of 0.20%), Immigrants from Latin America (12.6%, a difference of 0.34%), Immigrants from Liberia (12.8%, a difference of 1.1%), and Nepalese (12.5%, a difference of 1.2%).
| Demographics | Rating | Rank | Unemployment Among Youth under 25 years |
| Immigrants | Mexico | 0.1 /100 | #262 | Tragic 12.4% |
| Cree | 0.1 /100 | #263 | Tragic 12.4% |
| Puget Sound Salish | 0.1 /100 | #264 | Tragic 12.5% |
| Nepalese | 0.0 /100 | #265 | Tragic 12.5% |
| Immigrants | Latin America | 0.0 /100 | #266 | Tragic 12.6% |
| Sub-Saharan Africans | 0.0 /100 | #267 | Tragic 12.6% |
| Tlingit-Haida | 0.0 /100 | #268 | Tragic 12.7% |
| Kiowa | 0.0 /100 | #269 | Tragic 12.7% |
| Immigrants | Liberia | 0.0 /100 | #270 | Tragic 12.8% |
| Immigrants | Bahamas | 0.0 /100 | #271 | Tragic 12.9% |
| Cape Verdeans | 0.0 /100 | #272 | Tragic 12.9% |
| Nigerians | 0.0 /100 | #273 | Tragic 13.0% |
| Immigrants | Nigeria | 0.0 /100 | #274 | Tragic 13.0% |
| Bermudans | 0.0 /100 | #275 | Tragic 13.0% |
| Immigrants | Uzbekistan | 0.0 /100 | #276 | Tragic 13.1% |