Hmong vs Kiowa Associate's Degree
COMPARE
Hmong
Kiowa
Associate's Degree
Associate's Degree Comparison
Hmong
Kiowa
43.4%
ASSOCIATE'S DEGREE
3.2/ 100
METRIC RATING
228th/ 347
METRIC RANK
36.5%
ASSOCIATE'S DEGREE
0.0/ 100
METRIC RATING
326th/ 347
METRIC RANK
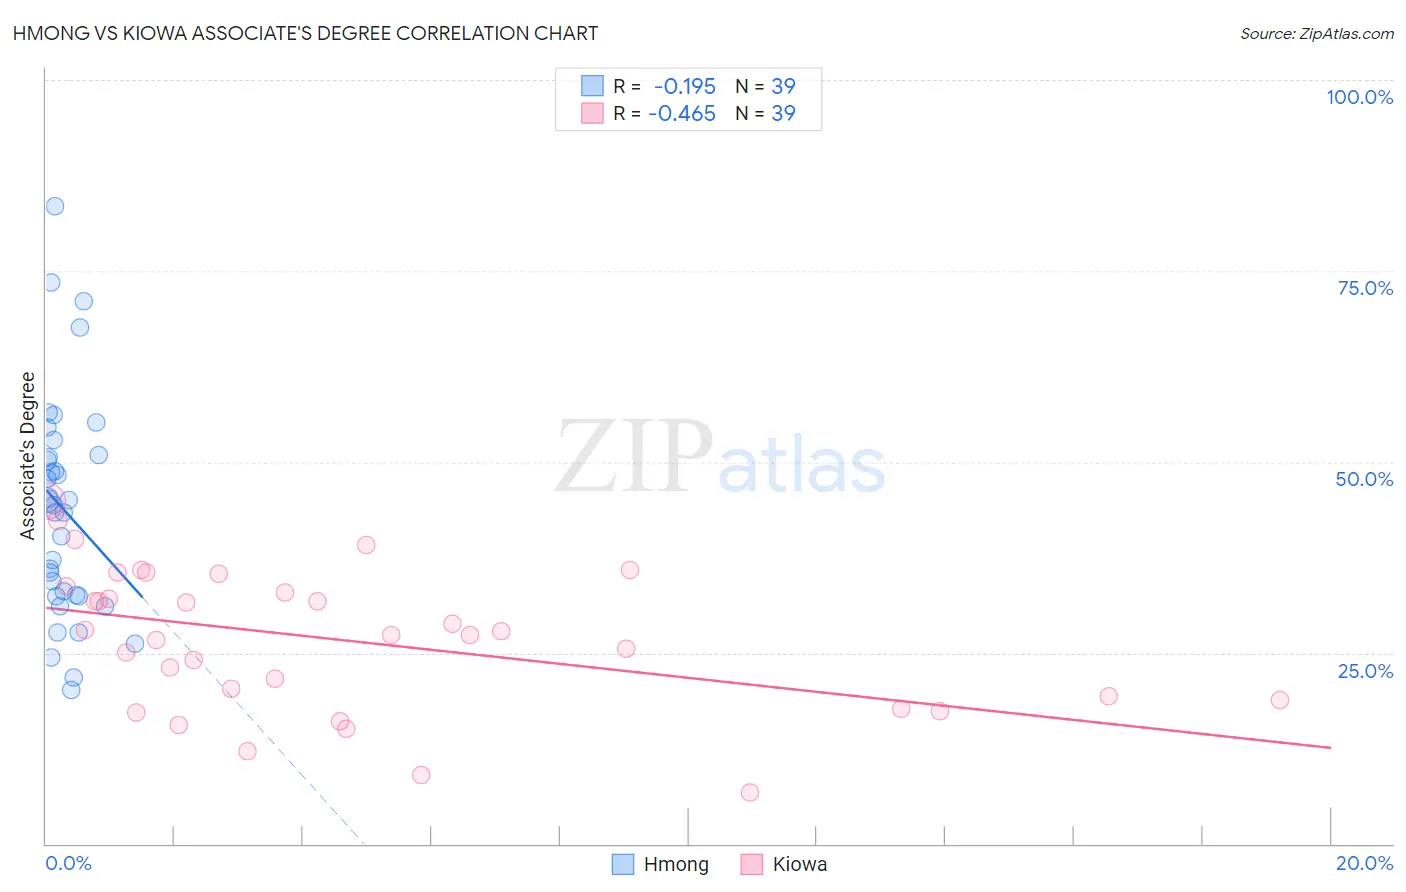
Hmong vs Kiowa Associate's Degree Correlation Chart
The statistical analysis conducted on geographies consisting of 24,680,511 people shows a poor negative correlation between the proportion of Hmong and percentage of population with at least associate's degree education in the United States with a correlation coefficient (R) of -0.195 and weighted average of 43.4%. Similarly, the statistical analysis conducted on geographies consisting of 56,101,363 people shows a moderate negative correlation between the proportion of Kiowa and percentage of population with at least associate's degree education in the United States with a correlation coefficient (R) of -0.465 and weighted average of 36.5%, a difference of 19.0%.
Associate's Degree Correlation Summary
| Measurement | Hmong | Kiowa |
| Minimum | 20.2% | 6.8% |
| Maximum | 83.4% | 44.8% |
| Range | 63.2% | 38.0% |
| Mean | 43.7% | 26.7% |
| Median | 44.4% | 27.3% |
| Interquartile 25% (IQ1) | 32.4% | 18.7% |
| Interquartile 75% (IQ3) | 50.9% | 33.7% |
| Interquartile Range (IQR) | 18.6% | 15.0% |
| Standard Deviation (Sample) | 14.5% | 9.3% |
| Standard Deviation (Population) | 14.3% | 9.2% |
Similar Demographics by Associate's Degree
Demographics Similar to Hmong by Associate's Degree
In terms of associate's degree, the demographic groups most similar to Hmong are Immigrants from Trinidad and Tobago (43.3%, a difference of 0.16%), Immigrants from Barbados (43.3%, a difference of 0.23%), Liberian (43.3%, a difference of 0.23%), Trinidadian and Tobagonian (43.6%, a difference of 0.44%), and Immigrants from Burma/Myanmar (43.7%, a difference of 0.62%).
| Demographics | Rating | Rank | Associate's Degree |
| Immigrants | Western Africa | 6.6 /100 | #221 | Tragic 44.1% |
| Barbadians | 5.8 /100 | #222 | Tragic 43.9% |
| Sub-Saharan Africans | 5.5 /100 | #223 | Tragic 43.9% |
| West Indians | 5.2 /100 | #224 | Tragic 43.8% |
| Guamanians/Chamorros | 4.8 /100 | #225 | Tragic 43.8% |
| Immigrants | Burma/Myanmar | 4.3 /100 | #226 | Tragic 43.7% |
| Trinidadians and Tobagonians | 4.0 /100 | #227 | Tragic 43.6% |
| Hmong | 3.2 /100 | #228 | Tragic 43.4% |
| Immigrants | Trinidad and Tobago | 3.0 /100 | #229 | Tragic 43.3% |
| Immigrants | Barbados | 2.9 /100 | #230 | Tragic 43.3% |
| Liberians | 2.9 /100 | #231 | Tragic 43.3% |
| Native Hawaiians | 2.3 /100 | #232 | Tragic 43.1% |
| Tongans | 2.2 /100 | #233 | Tragic 43.0% |
| Tlingit-Haida | 2.1 /100 | #234 | Tragic 43.0% |
| Ecuadorians | 2.0 /100 | #235 | Tragic 43.0% |
Demographics Similar to Kiowa by Associate's Degree
In terms of associate's degree, the demographic groups most similar to Kiowa are Dutch West Indian (36.5%, a difference of 0.020%), Alaskan Athabascan (36.5%, a difference of 0.030%), Paiute (36.4%, a difference of 0.32%), Menominee (36.7%, a difference of 0.56%), and Apache (36.2%, a difference of 0.63%).
| Demographics | Rating | Rank | Associate's Degree |
| Fijians | 0.0 /100 | #319 | Tragic 37.4% |
| Cajuns | 0.0 /100 | #320 | Tragic 37.4% |
| Immigrants | Yemen | 0.0 /100 | #321 | Tragic 37.3% |
| Pennsylvania Germans | 0.0 /100 | #322 | Tragic 37.2% |
| Immigrants | Cabo Verde | 0.0 /100 | #323 | Tragic 36.8% |
| Arapaho | 0.0 /100 | #324 | Tragic 36.7% |
| Menominee | 0.0 /100 | #325 | Tragic 36.7% |
| Kiowa | 0.0 /100 | #326 | Tragic 36.5% |
| Dutch West Indians | 0.0 /100 | #327 | Tragic 36.5% |
| Alaskan Athabascans | 0.0 /100 | #328 | Tragic 36.5% |
| Paiute | 0.0 /100 | #329 | Tragic 36.4% |
| Apache | 0.0 /100 | #330 | Tragic 36.2% |
| Immigrants | Azores | 0.0 /100 | #331 | Tragic 35.6% |
| Immigrants | Central America | 0.0 /100 | #332 | Tragic 35.0% |
| Mexicans | 0.0 /100 | #333 | Tragic 35.0% |