Immigrants from Southern Europe vs Kiowa Associate's Degree
COMPARE
Immigrants from Southern Europe
Kiowa
Associate's Degree
Associate's Degree Comparison
Immigrants from Southern Europe
Kiowa
47.8%
ASSOCIATE'S DEGREE
84.4/ 100
METRIC RATING
140th/ 347
METRIC RANK
36.5%
ASSOCIATE'S DEGREE
0.0/ 100
METRIC RATING
326th/ 347
METRIC RANK
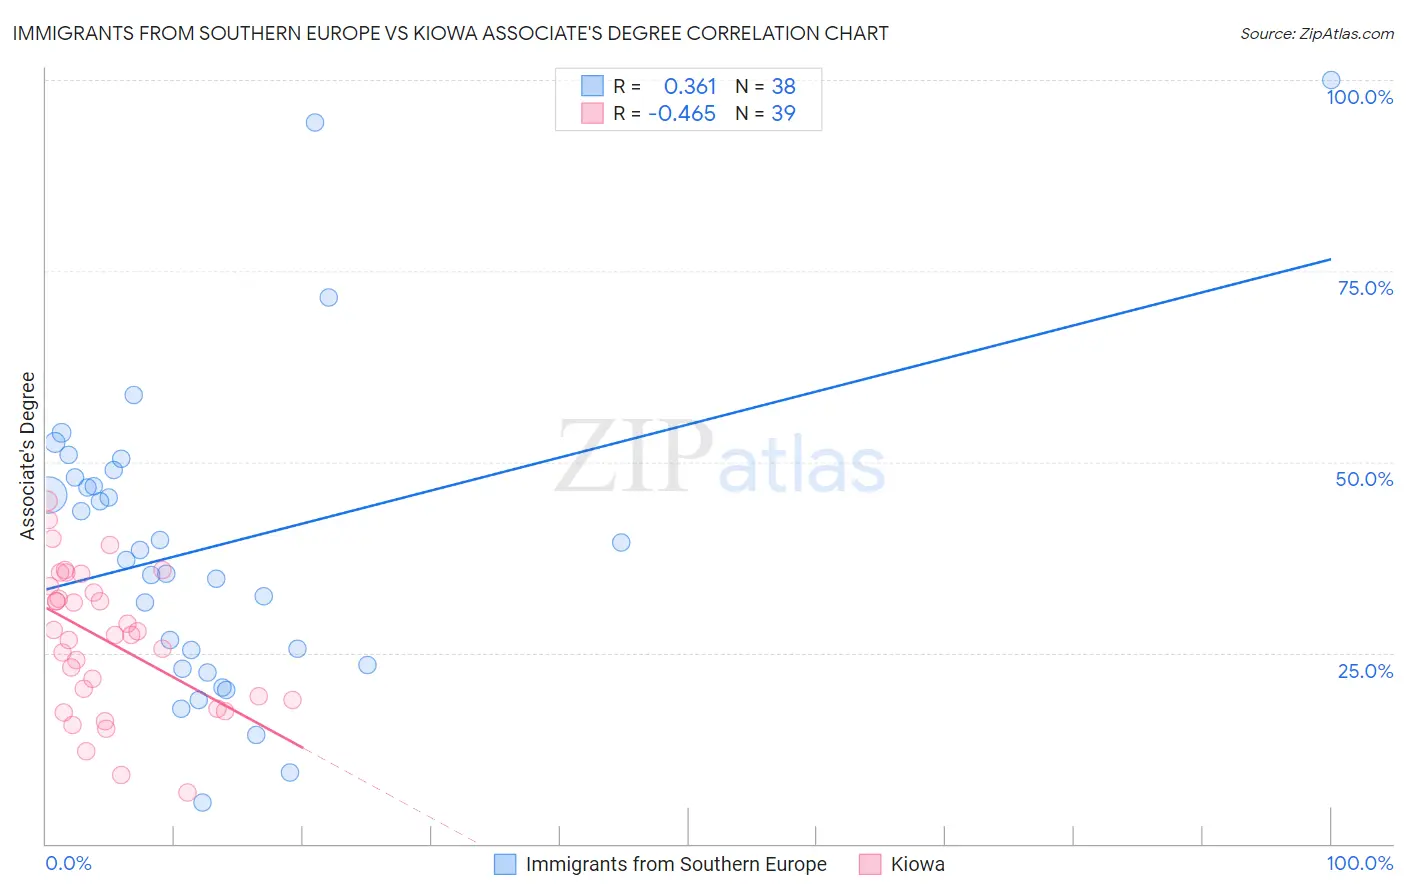
Immigrants from Southern Europe vs Kiowa Associate's Degree Correlation Chart
The statistical analysis conducted on geographies consisting of 402,795,863 people shows a mild positive correlation between the proportion of Immigrants from Southern Europe and percentage of population with at least associate's degree education in the United States with a correlation coefficient (R) of 0.361 and weighted average of 47.8%. Similarly, the statistical analysis conducted on geographies consisting of 56,101,363 people shows a moderate negative correlation between the proportion of Kiowa and percentage of population with at least associate's degree education in the United States with a correlation coefficient (R) of -0.465 and weighted average of 36.5%, a difference of 31.1%.
Associate's Degree Correlation Summary
| Measurement | Immigrants from Southern Europe | Kiowa |
| Minimum | 5.4% | 6.8% |
| Maximum | 100.0% | 44.8% |
| Range | 94.6% | 38.0% |
| Mean | 38.9% | 26.7% |
| Median | 37.8% | 27.3% |
| Interquartile 25% (IQ1) | 23.3% | 18.7% |
| Interquartile 75% (IQ3) | 48.0% | 33.7% |
| Interquartile Range (IQR) | 24.7% | 15.0% |
| Standard Deviation (Sample) | 20.1% | 9.3% |
| Standard Deviation (Population) | 19.9% | 9.2% |
Similar Demographics by Associate's Degree
Demographics Similar to Immigrants from Southern Europe by Associate's Degree
In terms of associate's degree, the demographic groups most similar to Immigrants from Southern Europe are Slovene (47.9%, a difference of 0.090%), Taiwanese (47.7%, a difference of 0.15%), Sierra Leonean (47.7%, a difference of 0.20%), Norwegian (47.6%, a difference of 0.43%), and Polish (48.0%, a difference of 0.44%).
| Demographics | Rating | Rank | Associate's Degree |
| Assyrians/Chaldeans/Syriacs | 89.4 /100 | #133 | Excellent 48.2% |
| Moroccans | 89.3 /100 | #134 | Excellent 48.2% |
| Europeans | 89.0 /100 | #135 | Excellent 48.2% |
| Pakistanis | 88.0 /100 | #136 | Excellent 48.1% |
| Immigrants | Eritrea | 87.8 /100 | #137 | Excellent 48.1% |
| Poles | 87.3 /100 | #138 | Excellent 48.0% |
| Slovenes | 85.1 /100 | #139 | Excellent 47.9% |
| Immigrants | Southern Europe | 84.4 /100 | #140 | Excellent 47.8% |
| Taiwanese | 83.3 /100 | #141 | Excellent 47.7% |
| Sierra Leoneans | 82.9 /100 | #142 | Excellent 47.7% |
| Norwegians | 81.0 /100 | #143 | Excellent 47.6% |
| Slavs | 80.5 /100 | #144 | Excellent 47.6% |
| Canadians | 79.0 /100 | #145 | Good 47.5% |
| Immigrants | Sudan | 77.9 /100 | #146 | Good 47.4% |
| Danes | 77.3 /100 | #147 | Good 47.4% |
Demographics Similar to Kiowa by Associate's Degree
In terms of associate's degree, the demographic groups most similar to Kiowa are Dutch West Indian (36.5%, a difference of 0.020%), Alaskan Athabascan (36.5%, a difference of 0.030%), Paiute (36.4%, a difference of 0.32%), Menominee (36.7%, a difference of 0.56%), and Apache (36.2%, a difference of 0.63%).
| Demographics | Rating | Rank | Associate's Degree |
| Fijians | 0.0 /100 | #319 | Tragic 37.4% |
| Cajuns | 0.0 /100 | #320 | Tragic 37.4% |
| Immigrants | Yemen | 0.0 /100 | #321 | Tragic 37.3% |
| Pennsylvania Germans | 0.0 /100 | #322 | Tragic 37.2% |
| Immigrants | Cabo Verde | 0.0 /100 | #323 | Tragic 36.8% |
| Arapaho | 0.0 /100 | #324 | Tragic 36.7% |
| Menominee | 0.0 /100 | #325 | Tragic 36.7% |
| Kiowa | 0.0 /100 | #326 | Tragic 36.5% |
| Dutch West Indians | 0.0 /100 | #327 | Tragic 36.5% |
| Alaskan Athabascans | 0.0 /100 | #328 | Tragic 36.5% |
| Paiute | 0.0 /100 | #329 | Tragic 36.4% |
| Apache | 0.0 /100 | #330 | Tragic 36.2% |
| Immigrants | Azores | 0.0 /100 | #331 | Tragic 35.6% |
| Immigrants | Central America | 0.0 /100 | #332 | Tragic 35.0% |
| Mexicans | 0.0 /100 | #333 | Tragic 35.0% |