Immigrants from Congo vs Immigrants from China Average Family Size
COMPARE
Immigrants from Congo
Immigrants from China
Average Family Size
Average Family Size Comparison
Immigrants from Congo
Immigrants from China
3.23
AVERAGE FAMILY SIZE
52.7/ 100
METRIC RATING
172nd/ 347
METRIC RANK
3.23
AVERAGE FAMILY SIZE
49.9/ 100
METRIC RATING
175th/ 347
METRIC RANK
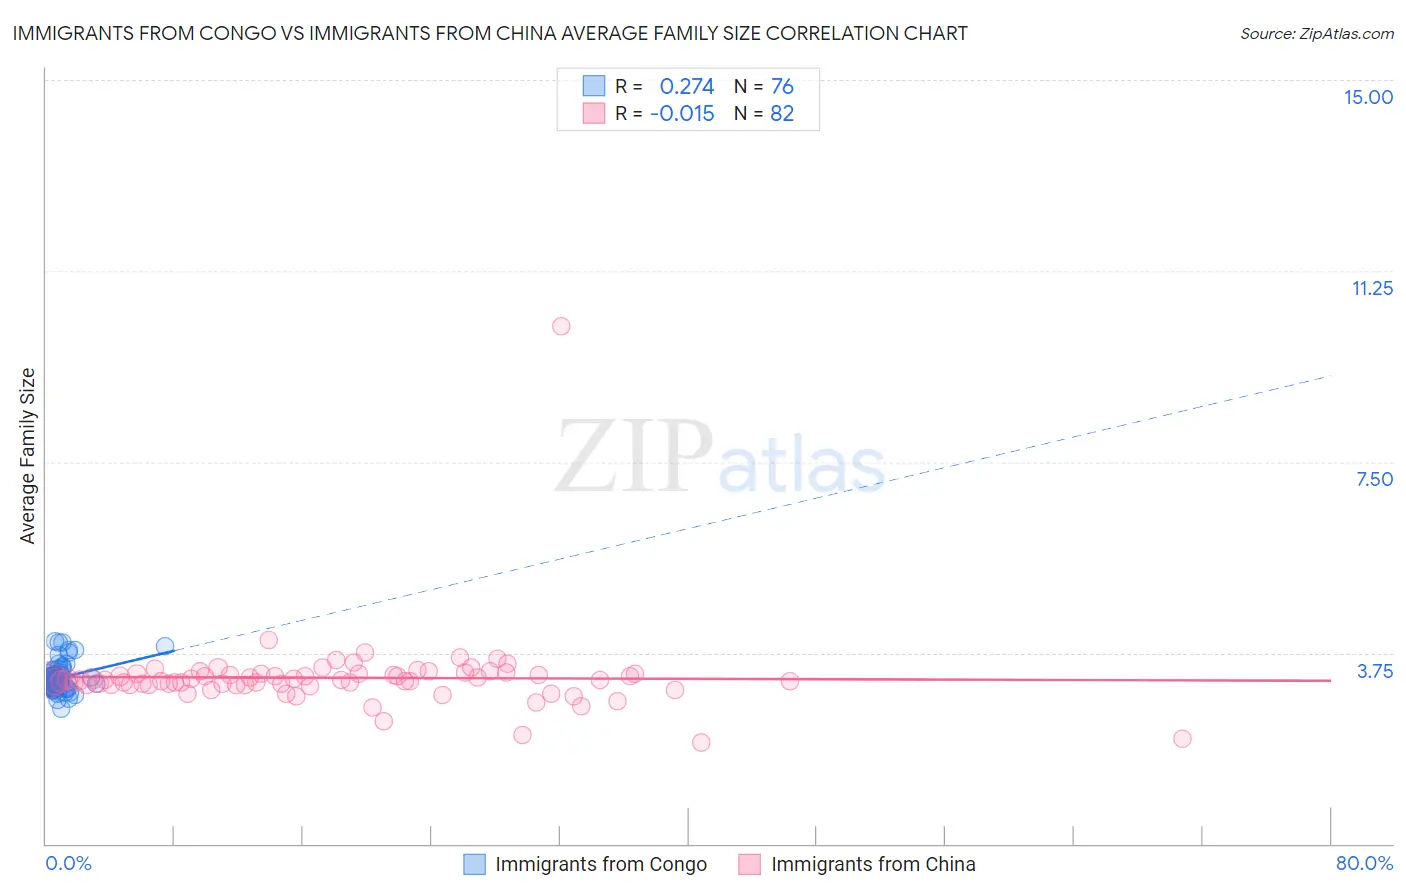
Immigrants from Congo vs Immigrants from China Average Family Size Correlation Chart
The statistical analysis conducted on geographies consisting of 92,087,751 people shows a weak positive correlation between the proportion of Immigrants from Congo and average family size in the United States with a correlation coefficient (R) of 0.274 and weighted average of 3.23. Similarly, the statistical analysis conducted on geographies consisting of 456,596,035 people shows no correlation between the proportion of Immigrants from China and average family size in the United States with a correlation coefficient (R) of -0.015 and weighted average of 3.23, a difference of 0.050%.
Average Family Size Correlation Summary
| Measurement | Immigrants from Congo | Immigrants from China |
| Minimum | 2.65 | 2.00 |
| Maximum | 3.97 | 10.17 |
| Range | 1.32 | 8.17 |
| Mean | 3.25 | 3.26 |
| Median | 3.21 | 3.21 |
| Interquartile 25% (IQ1) | 3.09 | 3.12 |
| Interquartile 75% (IQ3) | 3.32 | 3.33 |
| Interquartile Range (IQR) | 0.23 | 0.21 |
| Standard Deviation (Sample) | 0.26 | 0.84 |
| Standard Deviation (Population) | 0.26 | 0.83 |
Demographics Similar to Immigrants from Congo and Immigrants from China by Average Family Size
In terms of average family size, the demographic groups most similar to Immigrants from Congo are Chilean (3.23, a difference of 0.010%), Immigrants from Uruguay (3.23, a difference of 0.010%), Arab (3.23, a difference of 0.020%), Taiwanese (3.23, a difference of 0.030%), and Aleut (3.23, a difference of 0.030%). Similarly, the demographic groups most similar to Immigrants from China are Immigrants from South Central Asia (3.23, a difference of 0.0%), Israeli (3.23, a difference of 0.020%), Immigrants from Uruguay (3.23, a difference of 0.040%), Argentinean (3.23, a difference of 0.050%), and Spaniard (3.23, a difference of 0.050%).
| Demographics | Rating | Rank | Average Family Size |
| Uruguayans | 58.8 /100 | #163 | Average 3.23 |
| Egyptians | 58.6 /100 | #164 | Average 3.23 |
| Ugandans | 58.4 /100 | #165 | Average 3.23 |
| Immigrants | Senegal | 57.5 /100 | #166 | Average 3.23 |
| Dutch West Indians | 56.9 /100 | #167 | Average 3.23 |
| Taiwanese | 54.2 /100 | #168 | Average 3.23 |
| Aleuts | 54.1 /100 | #169 | Average 3.23 |
| Arabs | 53.8 /100 | #170 | Average 3.23 |
| Chileans | 53.2 /100 | #171 | Average 3.23 |
| Immigrants | Congo | 52.7 /100 | #172 | Average 3.23 |
| Immigrants | Uruguay | 52.0 /100 | #173 | Average 3.23 |
| Immigrants | South Central Asia | 50.0 /100 | #174 | Average 3.23 |
| Immigrants | China | 49.9 /100 | #175 | Average 3.23 |
| Israelis | 48.7 /100 | #176 | Average 3.23 |
| Argentineans | 47.4 /100 | #177 | Average 3.23 |
| Spaniards | 47.2 /100 | #178 | Average 3.23 |
| Immigrants | Korea | 46.9 /100 | #179 | Average 3.23 |
| Palestinians | 46.6 /100 | #180 | Average 3.23 |
| Spanish | 44.8 /100 | #181 | Average 3.23 |
| Moroccans | 44.2 /100 | #182 | Average 3.22 |
| Immigrants | Northern Africa | 41.7 /100 | #183 | Average 3.22 |