Immigrants from Switzerland vs Egyptian Bachelor's Degree
COMPARE
Immigrants from Switzerland
Egyptian
Bachelor's Degree
Bachelor's Degree Comparison
Immigrants from Switzerland
Egyptians
47.1%
BACHELOR'S DEGREE
100.0/ 100
METRIC RATING
20th/ 347
METRIC RANK
43.3%
BACHELOR'S DEGREE
99.7/ 100
METRIC RATING
67th/ 347
METRIC RANK
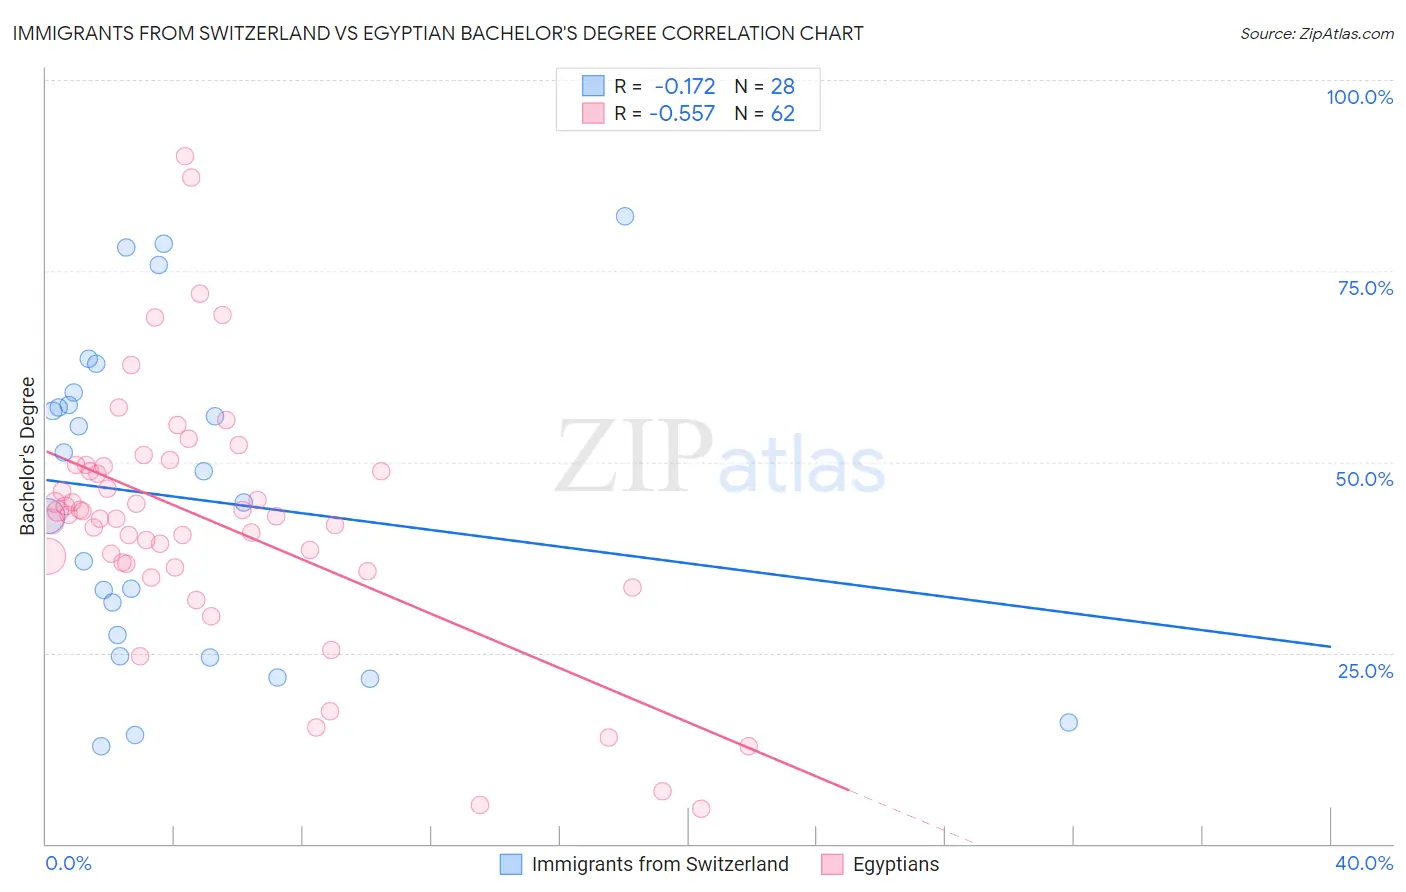
Immigrants from Switzerland vs Egyptian Bachelor's Degree Correlation Chart
The statistical analysis conducted on geographies consisting of 148,083,391 people shows a poor negative correlation between the proportion of Immigrants from Switzerland and percentage of population with at least bachelor's degree education in the United States with a correlation coefficient (R) of -0.172 and weighted average of 47.1%. Similarly, the statistical analysis conducted on geographies consisting of 276,908,448 people shows a substantial negative correlation between the proportion of Egyptians and percentage of population with at least bachelor's degree education in the United States with a correlation coefficient (R) of -0.557 and weighted average of 43.3%, a difference of 8.9%.
Bachelor's Degree Correlation Summary
| Measurement | Immigrants from Switzerland | Egyptian |
| Minimum | 12.8% | 4.6% |
| Maximum | 82.2% | 90.0% |
| Range | 69.5% | 85.4% |
| Mean | 45.3% | 42.3% |
| Median | 46.7% | 43.0% |
| Interquartile 25% (IQ1) | 26.0% | 36.6% |
| Interquartile 75% (IQ3) | 58.3% | 49.5% |
| Interquartile Range (IQR) | 32.3% | 12.8% |
| Standard Deviation (Sample) | 20.8% | 16.5% |
| Standard Deviation (Population) | 20.4% | 16.3% |
Similar Demographics by Bachelor's Degree
Demographics Similar to Immigrants from Switzerland by Bachelor's Degree
In terms of bachelor's degree, the demographic groups most similar to Immigrants from Switzerland are Immigrants from Ireland (47.1%, a difference of 0.010%), Immigrants from Belgium (47.0%, a difference of 0.21%), Cambodian (47.2%, a difference of 0.22%), Immigrants from Sweden (47.0%, a difference of 0.30%), and Immigrants from Korea (47.0%, a difference of 0.34%).
| Demographics | Rating | Rank | Bachelor's Degree |
| Immigrants | South Central Asia | 100.0 /100 | #13 | Exceptional 48.3% |
| Immigrants | Hong Kong | 100.0 /100 | #14 | Exceptional 48.2% |
| Immigrants | Eastern Asia | 100.0 /100 | #15 | Exceptional 48.1% |
| Soviet Union | 100.0 /100 | #16 | Exceptional 47.9% |
| Eastern Europeans | 100.0 /100 | #17 | Exceptional 47.5% |
| Indians (Asian) | 100.0 /100 | #18 | Exceptional 47.4% |
| Cambodians | 100.0 /100 | #19 | Exceptional 47.2% |
| Immigrants | Switzerland | 100.0 /100 | #20 | Exceptional 47.1% |
| Immigrants | Ireland | 100.0 /100 | #21 | Exceptional 47.1% |
| Immigrants | Belgium | 100.0 /100 | #22 | Exceptional 47.0% |
| Immigrants | Sweden | 100.0 /100 | #23 | Exceptional 47.0% |
| Immigrants | Korea | 100.0 /100 | #24 | Exceptional 47.0% |
| Burmese | 100.0 /100 | #25 | Exceptional 46.9% |
| Immigrants | Japan | 100.0 /100 | #26 | Exceptional 46.8% |
| Immigrants | France | 100.0 /100 | #27 | Exceptional 46.4% |
Demographics Similar to Egyptians by Bachelor's Degree
In terms of bachelor's degree, the demographic groups most similar to Egyptians are Immigrants from Netherlands (43.3%, a difference of 0.020%), Immigrants from Indonesia (43.3%, a difference of 0.020%), Zimbabwean (43.3%, a difference of 0.040%), Argentinean (43.3%, a difference of 0.050%), and Immigrants from Pakistan (43.1%, a difference of 0.28%).
| Demographics | Rating | Rank | Bachelor's Degree |
| New Zealanders | 99.9 /100 | #60 | Exceptional 44.0% |
| South Africans | 99.8 /100 | #61 | Exceptional 43.6% |
| Immigrants | Kazakhstan | 99.8 /100 | #62 | Exceptional 43.4% |
| Immigrants | Europe | 99.8 /100 | #63 | Exceptional 43.4% |
| Argentineans | 99.7 /100 | #64 | Exceptional 43.3% |
| Zimbabweans | 99.7 /100 | #65 | Exceptional 43.3% |
| Immigrants | Netherlands | 99.7 /100 | #66 | Exceptional 43.3% |
| Egyptians | 99.7 /100 | #67 | Exceptional 43.3% |
| Immigrants | Indonesia | 99.7 /100 | #68 | Exceptional 43.3% |
| Immigrants | Pakistan | 99.7 /100 | #69 | Exceptional 43.1% |
| Immigrants | Romania | 99.6 /100 | #70 | Exceptional 42.9% |
| Immigrants | Argentina | 99.6 /100 | #71 | Exceptional 42.8% |
| Ethiopians | 99.5 /100 | #72 | Exceptional 42.8% |
| Immigrants | Uzbekistan | 99.5 /100 | #73 | Exceptional 42.8% |
| Bhutanese | 99.5 /100 | #74 | Exceptional 42.7% |