Immigrants from Sri Lanka vs Dominican 3rd Grade
COMPARE
Immigrants from Sri Lanka
Dominican
3rd Grade
3rd Grade Comparison
Immigrants from Sri Lanka
Dominicans
97.7%
3RD GRADE
45.1/ 100
METRIC RATING
180th/ 347
METRIC RANK
96.4%
3RD GRADE
0.0/ 100
METRIC RATING
324th/ 347
METRIC RANK
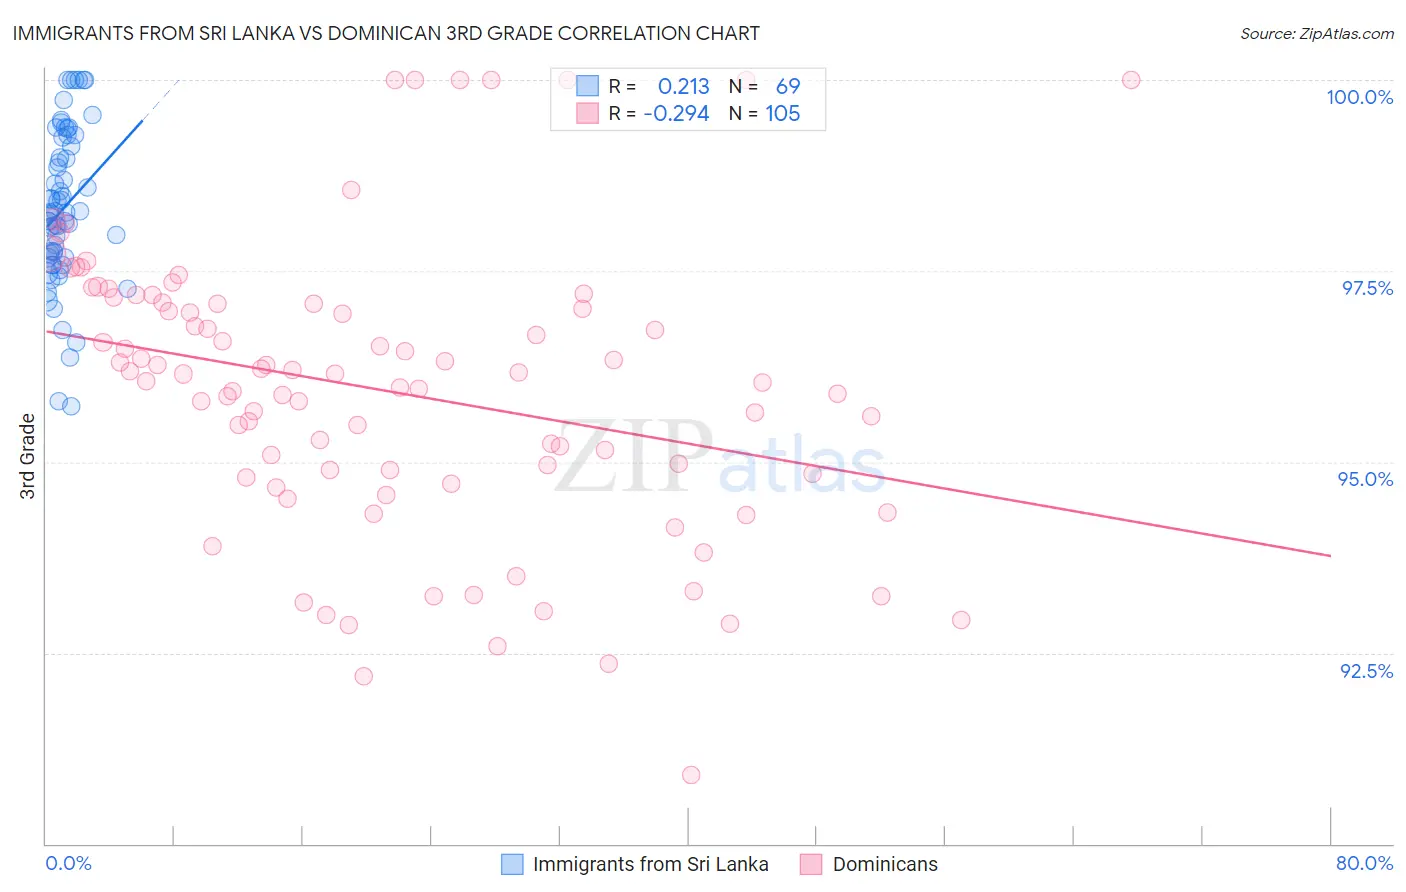
Immigrants from Sri Lanka vs Dominican 3rd Grade Correlation Chart
The statistical analysis conducted on geographies consisting of 149,700,552 people shows a weak positive correlation between the proportion of Immigrants from Sri Lanka and percentage of population with at least 3rd grade education in the United States with a correlation coefficient (R) of 0.213 and weighted average of 97.7%. Similarly, the statistical analysis conducted on geographies consisting of 355,142,603 people shows a weak negative correlation between the proportion of Dominicans and percentage of population with at least 3rd grade education in the United States with a correlation coefficient (R) of -0.294 and weighted average of 96.4%, a difference of 1.4%.
3rd Grade Correlation Summary
| Measurement | Immigrants from Sri Lanka | Dominican |
| Minimum | 95.7% | 90.9% |
| Maximum | 100.0% | 100.0% |
| Range | 4.3% | 9.1% |
| Mean | 98.3% | 95.9% |
| Median | 98.3% | 96.1% |
| Interquartile 25% (IQ1) | 97.7% | 94.8% |
| Interquartile 75% (IQ3) | 99.2% | 97.1% |
| Interquartile Range (IQR) | 1.5% | 2.3% |
| Standard Deviation (Sample) | 1.0% | 1.9% |
| Standard Deviation (Population) | 1.00% | 1.9% |
Similar Demographics by 3rd Grade
Demographics Similar to Immigrants from Sri Lanka by 3rd Grade
In terms of 3rd grade, the demographic groups most similar to Immigrants from Sri Lanka are Immigrants from Brazil (97.7%, a difference of 0.0%), Immigrants from Belarus (97.7%, a difference of 0.0%), Immigrants from Venezuela (97.7%, a difference of 0.0%), Immigrants from Micronesia (97.8%, a difference of 0.010%), and Immigrants from Poland (97.8%, a difference of 0.010%).
| Demographics | Rating | Rank | 3rd Grade |
| Immigrants | Korea | 50.9 /100 | #173 | Average 97.8% |
| Navajo | 50.0 /100 | #174 | Average 97.8% |
| Immigrants | Micronesia | 47.6 /100 | #175 | Average 97.8% |
| Immigrants | Poland | 47.1 /100 | #176 | Average 97.8% |
| Egyptians | 46.6 /100 | #177 | Average 97.7% |
| Immigrants | Brazil | 46.4 /100 | #178 | Average 97.7% |
| Immigrants | Belarus | 45.9 /100 | #179 | Average 97.7% |
| Immigrants | Sri Lanka | 45.1 /100 | #180 | Average 97.7% |
| Immigrants | Venezuela | 44.4 /100 | #181 | Average 97.7% |
| Argentineans | 42.9 /100 | #182 | Average 97.7% |
| Arabs | 40.0 /100 | #183 | Fair 97.7% |
| Immigrants | Kazakhstan | 37.4 /100 | #184 | Fair 97.7% |
| Immigrants | Argentina | 37.0 /100 | #185 | Fair 97.7% |
| Portuguese | 36.2 /100 | #186 | Fair 97.7% |
| Natives/Alaskans | 35.2 /100 | #187 | Fair 97.7% |
Demographics Similar to Dominicans by 3rd Grade
In terms of 3rd grade, the demographic groups most similar to Dominicans are Mexican American Indian (96.4%, a difference of 0.010%), Immigrants from Vietnam (96.4%, a difference of 0.050%), Japanese (96.4%, a difference of 0.060%), Bangladeshi (96.3%, a difference of 0.060%), and Honduran (96.5%, a difference of 0.080%).
| Demographics | Rating | Rank | 3rd Grade |
| Immigrants | Bangladesh | 0.0 /100 | #317 | Tragic 96.6% |
| Hispanics or Latinos | 0.0 /100 | #318 | Tragic 96.5% |
| Vietnamese | 0.0 /100 | #319 | Tragic 96.5% |
| Immigrants | Nicaragua | 0.0 /100 | #320 | Tragic 96.5% |
| Indonesians | 0.0 /100 | #321 | Tragic 96.5% |
| Immigrants | Belize | 0.0 /100 | #322 | Tragic 96.5% |
| Hondurans | 0.0 /100 | #323 | Tragic 96.5% |
| Dominicans | 0.0 /100 | #324 | Tragic 96.4% |
| Mexican American Indians | 0.0 /100 | #325 | Tragic 96.4% |
| Immigrants | Vietnam | 0.0 /100 | #326 | Tragic 96.4% |
| Japanese | 0.0 /100 | #327 | Tragic 96.4% |
| Bangladeshis | 0.0 /100 | #328 | Tragic 96.3% |
| Immigrants | Honduras | 0.0 /100 | #329 | Tragic 96.3% |
| Immigrants | Armenia | 0.0 /100 | #330 | Tragic 96.3% |
| Immigrants | Latin America | 0.0 /100 | #331 | Tragic 96.2% |