French vs Dominican 3rd Grade
COMPARE
French
Dominican
3rd Grade
3rd Grade Comparison
French
Dominicans
98.4%
3RD GRADE
100.0/ 100
METRIC RATING
28th/ 347
METRIC RANK
96.4%
3RD GRADE
0.0/ 100
METRIC RATING
324th/ 347
METRIC RANK
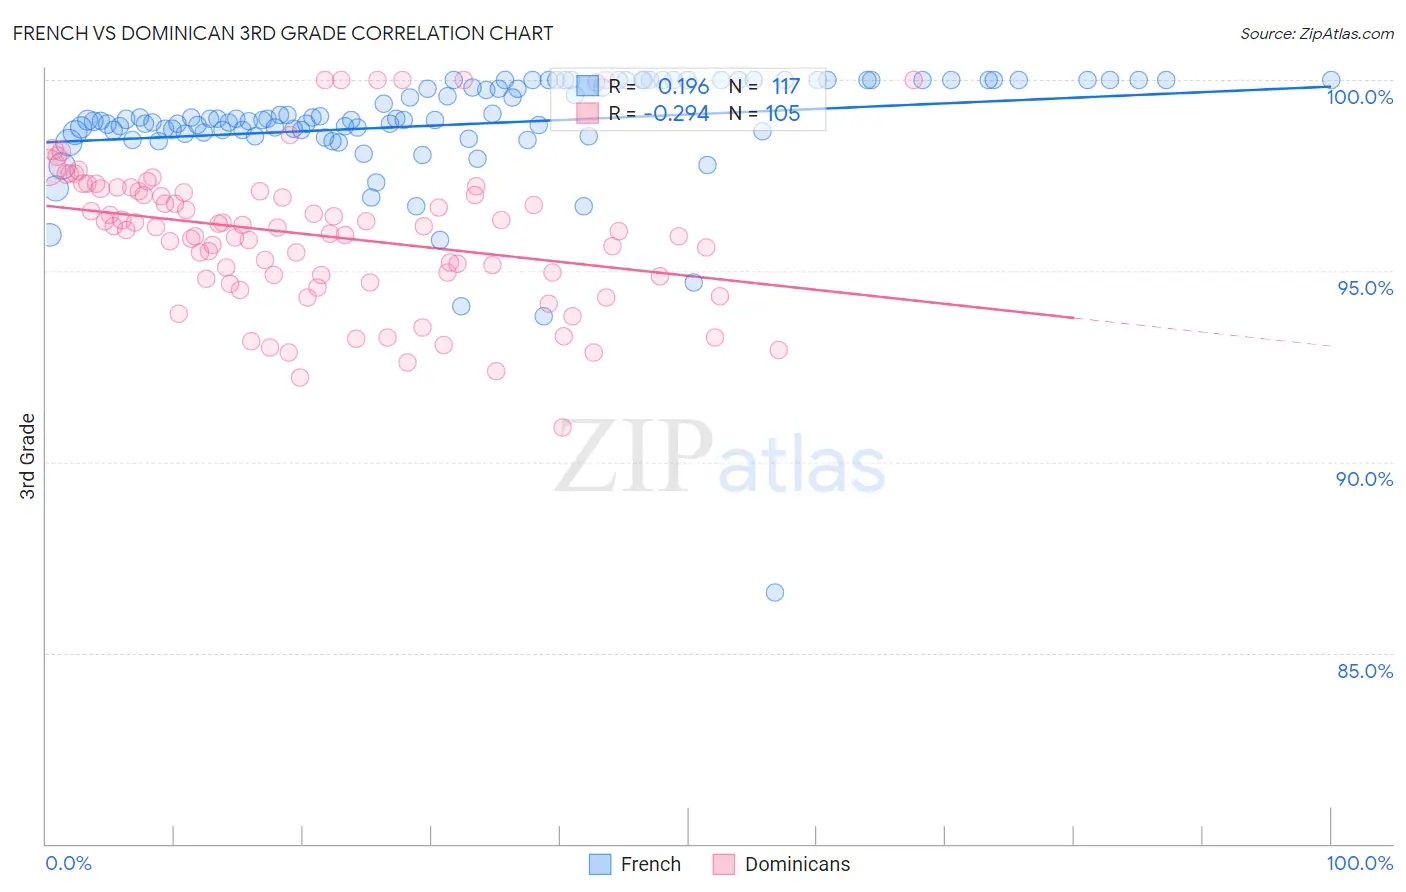
French vs Dominican 3rd Grade Correlation Chart
The statistical analysis conducted on geographies consisting of 572,427,269 people shows a poor positive correlation between the proportion of French and percentage of population with at least 3rd grade education in the United States with a correlation coefficient (R) of 0.196 and weighted average of 98.4%. Similarly, the statistical analysis conducted on geographies consisting of 355,142,603 people shows a weak negative correlation between the proportion of Dominicans and percentage of population with at least 3rd grade education in the United States with a correlation coefficient (R) of -0.294 and weighted average of 96.4%, a difference of 2.1%.
3rd Grade Correlation Summary
| Measurement | French | Dominican |
| Minimum | 86.6% | 90.9% |
| Maximum | 100.0% | 100.0% |
| Range | 13.4% | 9.1% |
| Mean | 98.8% | 95.9% |
| Median | 99.0% | 96.1% |
| Interquartile 25% (IQ1) | 98.6% | 94.8% |
| Interquartile 75% (IQ3) | 100.0% | 97.1% |
| Interquartile Range (IQR) | 1.4% | 2.3% |
| Standard Deviation (Sample) | 1.6% | 1.9% |
| Standard Deviation (Population) | 1.6% | 1.9% |
Similar Demographics by 3rd Grade
Demographics Similar to French by 3rd Grade
In terms of 3rd grade, the demographic groups most similar to French are Croatian (98.5%, a difference of 0.010%), French Canadian (98.4%, a difference of 0.010%), European (98.4%, a difference of 0.010%), Czech (98.4%, a difference of 0.010%), and Scotch-Irish (98.5%, a difference of 0.020%).
| Demographics | Rating | Rank | 3rd Grade |
| Lithuanians | 100.0 /100 | #21 | Exceptional 98.5% |
| Finns | 100.0 /100 | #22 | Exceptional 98.5% |
| Sioux | 100.0 /100 | #23 | Exceptional 98.5% |
| Danes | 100.0 /100 | #24 | Exceptional 98.5% |
| Scotch-Irish | 100.0 /100 | #25 | Exceptional 98.5% |
| Aleuts | 100.0 /100 | #26 | Exceptional 98.5% |
| Croatians | 100.0 /100 | #27 | Exceptional 98.5% |
| French | 100.0 /100 | #28 | Exceptional 98.4% |
| French Canadians | 100.0 /100 | #29 | Exceptional 98.4% |
| Europeans | 100.0 /100 | #30 | Exceptional 98.4% |
| Czechs | 100.0 /100 | #31 | Exceptional 98.4% |
| Scandinavians | 100.0 /100 | #32 | Exceptional 98.4% |
| Chinese | 100.0 /100 | #33 | Exceptional 98.4% |
| Swiss | 100.0 /100 | #34 | Exceptional 98.4% |
| Arapaho | 100.0 /100 | #35 | Exceptional 98.4% |
Demographics Similar to Dominicans by 3rd Grade
In terms of 3rd grade, the demographic groups most similar to Dominicans are Mexican American Indian (96.4%, a difference of 0.010%), Immigrants from Vietnam (96.4%, a difference of 0.050%), Japanese (96.4%, a difference of 0.060%), Bangladeshi (96.3%, a difference of 0.060%), and Honduran (96.5%, a difference of 0.080%).
| Demographics | Rating | Rank | 3rd Grade |
| Immigrants | Bangladesh | 0.0 /100 | #317 | Tragic 96.6% |
| Hispanics or Latinos | 0.0 /100 | #318 | Tragic 96.5% |
| Vietnamese | 0.0 /100 | #319 | Tragic 96.5% |
| Immigrants | Nicaragua | 0.0 /100 | #320 | Tragic 96.5% |
| Indonesians | 0.0 /100 | #321 | Tragic 96.5% |
| Immigrants | Belize | 0.0 /100 | #322 | Tragic 96.5% |
| Hondurans | 0.0 /100 | #323 | Tragic 96.5% |
| Dominicans | 0.0 /100 | #324 | Tragic 96.4% |
| Mexican American Indians | 0.0 /100 | #325 | Tragic 96.4% |
| Immigrants | Vietnam | 0.0 /100 | #326 | Tragic 96.4% |
| Japanese | 0.0 /100 | #327 | Tragic 96.4% |
| Bangladeshis | 0.0 /100 | #328 | Tragic 96.3% |
| Immigrants | Honduras | 0.0 /100 | #329 | Tragic 96.3% |
| Immigrants | Armenia | 0.0 /100 | #330 | Tragic 96.3% |
| Immigrants | Latin America | 0.0 /100 | #331 | Tragic 96.2% |