Immigrants from El Salvador vs African 3rd Grade
COMPARE
Immigrants from El Salvador
African
3rd Grade
3rd Grade Comparison
Immigrants from El Salvador
Africans
95.5%
3RD GRADE
0.0/ 100
METRIC RATING
346th/ 347
METRIC RANK
97.6%
3RD GRADE
14.5/ 100
METRIC RATING
205th/ 347
METRIC RANK
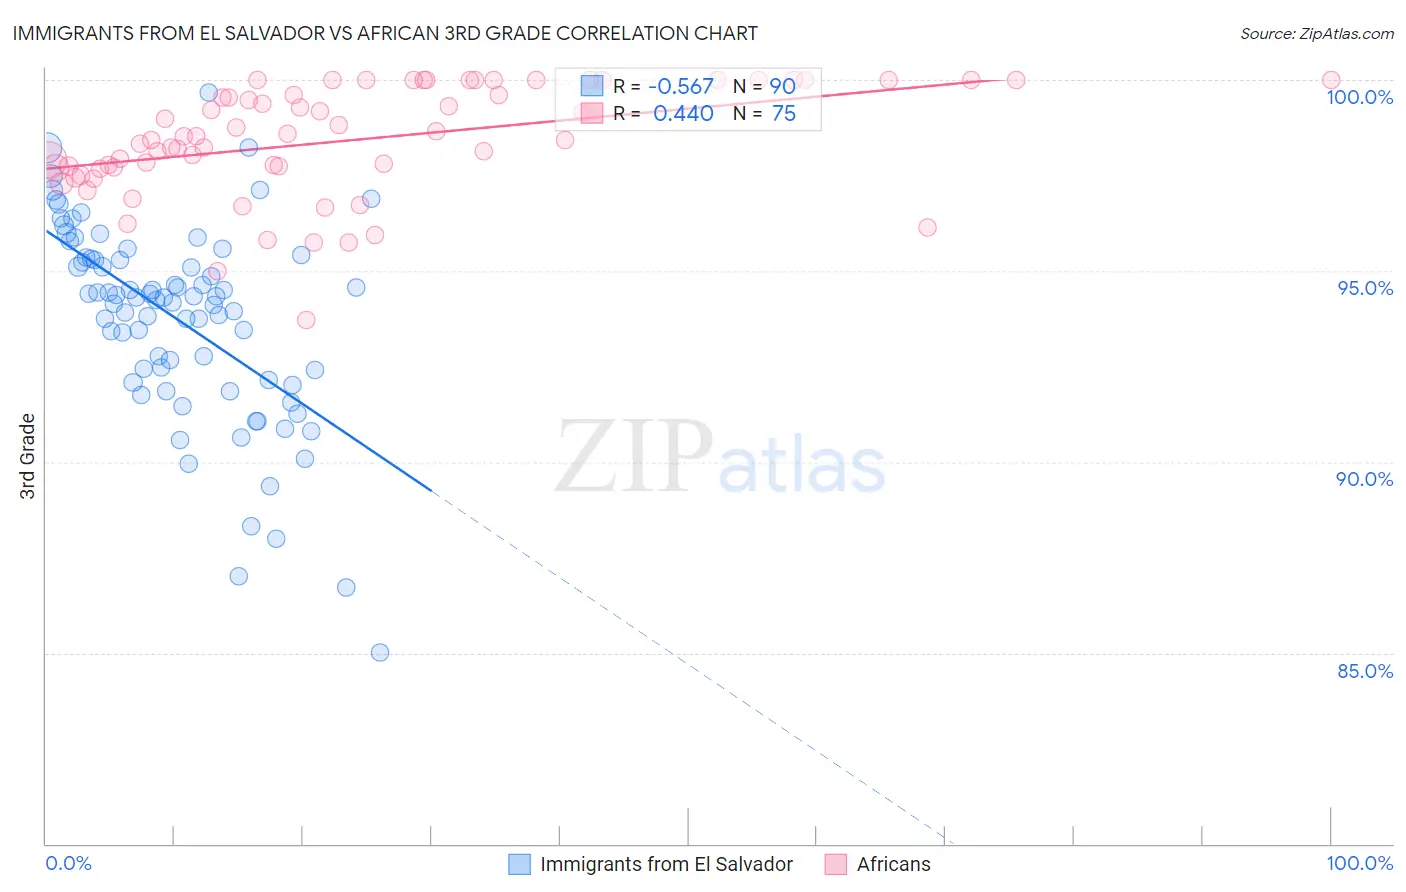
Immigrants from El Salvador vs African 3rd Grade Correlation Chart
The statistical analysis conducted on geographies consisting of 357,852,938 people shows a substantial negative correlation between the proportion of Immigrants from El Salvador and percentage of population with at least 3rd grade education in the United States with a correlation coefficient (R) of -0.567 and weighted average of 95.5%. Similarly, the statistical analysis conducted on geographies consisting of 470,094,148 people shows a moderate positive correlation between the proportion of Africans and percentage of population with at least 3rd grade education in the United States with a correlation coefficient (R) of 0.440 and weighted average of 97.6%, a difference of 2.2%.
3rd Grade Correlation Summary
| Measurement | Immigrants from El Salvador | African |
| Minimum | 85.0% | 93.7% |
| Maximum | 99.7% | 100.0% |
| Range | 14.7% | 6.3% |
| Mean | 93.7% | 98.4% |
| Median | 94.3% | 98.5% |
| Interquartile 25% (IQ1) | 92.1% | 97.7% |
| Interquartile 75% (IQ3) | 95.3% | 100.0% |
| Interquartile Range (IQR) | 3.2% | 2.3% |
| Standard Deviation (Sample) | 2.6% | 1.4% |
| Standard Deviation (Population) | 2.6% | 1.4% |
Similar Demographics by 3rd Grade
Demographics Similar to Immigrants from El Salvador by 3rd Grade
In terms of 3rd grade, the demographic groups most similar to Immigrants from El Salvador are Immigrants from Yemen (95.6%, a difference of 0.060%), Salvadoran (95.7%, a difference of 0.19%), Spanish American Indian (95.3%, a difference of 0.26%), Immigrants from Mexico (95.8%, a difference of 0.30%), and Immigrants from Central America (95.8%, a difference of 0.33%).
| Demographics | Rating | Rank | 3rd Grade |
| Immigrants | Fiji | 0.0 /100 | #333 | Tragic 96.2% |
| Immigrants | Cambodia | 0.0 /100 | #334 | Tragic 96.2% |
| Immigrants | Dominican Republic | 0.0 /100 | #335 | Tragic 96.2% |
| Immigrants | Cabo Verde | 0.0 /100 | #336 | Tragic 96.2% |
| Central Americans | 0.0 /100 | #337 | Tragic 96.1% |
| Guatemalans | 0.0 /100 | #338 | Tragic 96.0% |
| Yakama | 0.0 /100 | #339 | Tragic 95.9% |
| Nepalese | 0.0 /100 | #340 | Tragic 95.9% |
| Immigrants | Central America | 0.0 /100 | #341 | Tragic 95.8% |
| Immigrants | Guatemala | 0.0 /100 | #342 | Tragic 95.8% |
| Immigrants | Mexico | 0.0 /100 | #343 | Tragic 95.8% |
| Salvadorans | 0.0 /100 | #344 | Tragic 95.7% |
| Immigrants | Yemen | 0.0 /100 | #345 | Tragic 95.6% |
| Immigrants | El Salvador | 0.0 /100 | #346 | Tragic 95.5% |
| Spanish American Indians | 0.0 /100 | #347 | Tragic 95.3% |
Demographics Similar to Africans by 3rd Grade
In terms of 3rd grade, the demographic groups most similar to Africans are Paiute (97.6%, a difference of 0.010%), Immigrants from Chile (97.6%, a difference of 0.010%), Immigrants from Northern Africa (97.6%, a difference of 0.010%), Tohono O'odham (97.6%, a difference of 0.010%), and Immigrants from Southern Europe (97.6%, a difference of 0.020%).
| Demographics | Rating | Rank | 3rd Grade |
| Guamanians/Chamorros | 23.6 /100 | #198 | Fair 97.7% |
| Immigrants | Ukraine | 22.7 /100 | #199 | Fair 97.7% |
| Immigrants | Albania | 22.6 /100 | #200 | Fair 97.7% |
| Immigrants | Lebanon | 21.7 /100 | #201 | Fair 97.7% |
| Immigrants | Southern Europe | 17.7 /100 | #202 | Poor 97.6% |
| Paiute | 16.7 /100 | #203 | Poor 97.6% |
| Immigrants | Chile | 16.5 /100 | #204 | Poor 97.6% |
| Africans | 14.5 /100 | #205 | Poor 97.6% |
| Immigrants | Northern Africa | 13.0 /100 | #206 | Poor 97.6% |
| Tohono O'odham | 12.5 /100 | #207 | Poor 97.6% |
| Immigrants | Zaire | 11.9 /100 | #208 | Poor 97.6% |
| Costa Ricans | 9.6 /100 | #209 | Tragic 97.6% |
| Immigrants | Oceania | 9.5 /100 | #210 | Tragic 97.6% |
| Laotians | 9.4 /100 | #211 | Tragic 97.6% |
| Immigrants | Bahamas | 8.5 /100 | #212 | Tragic 97.6% |