Cape Verdean vs African 3rd Grade
COMPARE
Cape Verdean
African
3rd Grade
3rd Grade Comparison
Cape Verdeans
Africans
96.6%
3RD GRADE
0.0/ 100
METRIC RATING
310th/ 347
METRIC RANK
97.6%
3RD GRADE
14.5/ 100
METRIC RATING
205th/ 347
METRIC RANK
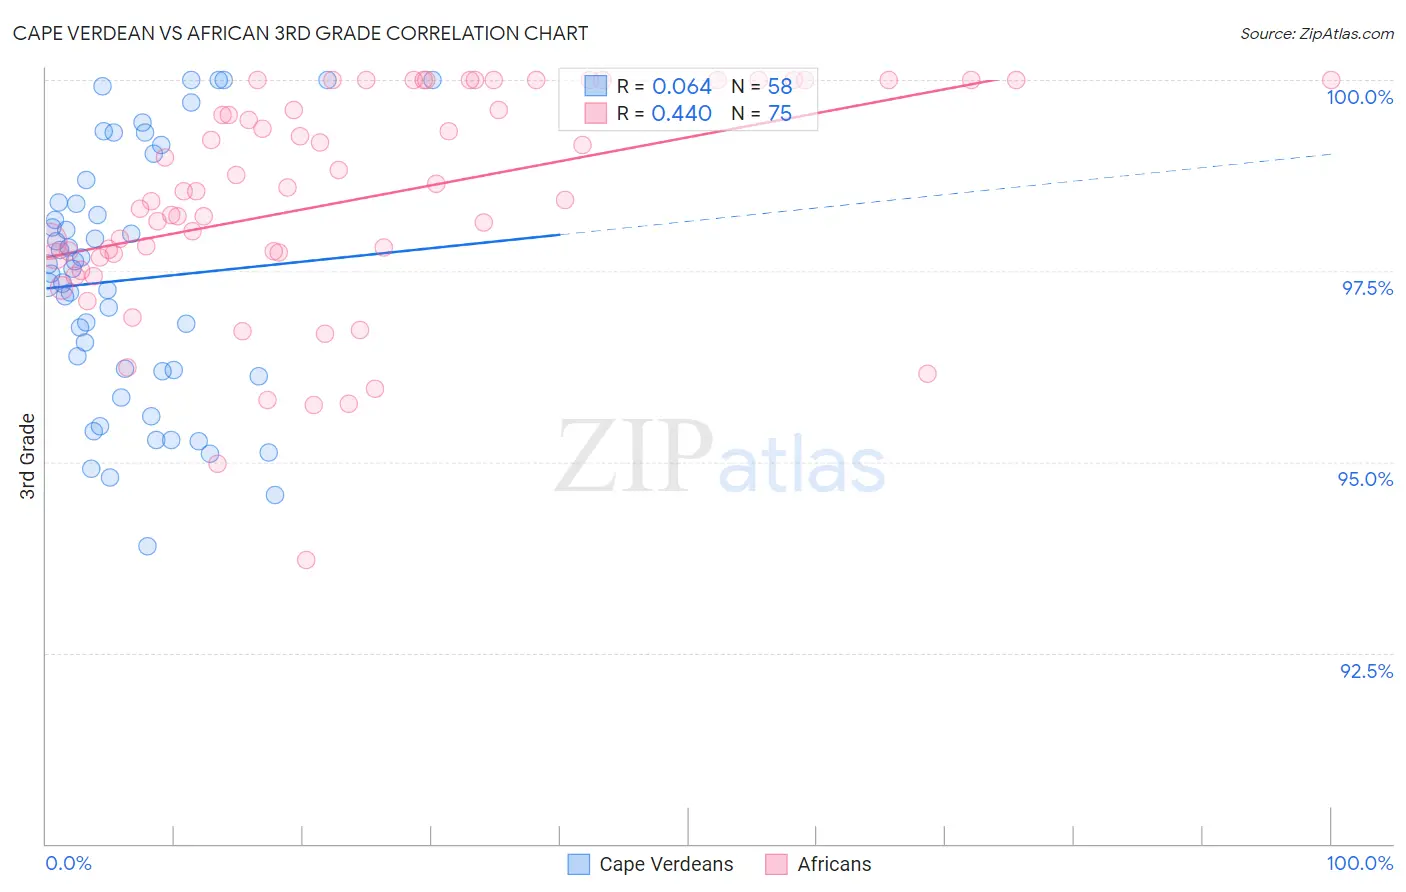
Cape Verdean vs African 3rd Grade Correlation Chart
The statistical analysis conducted on geographies consisting of 107,537,955 people shows a slight positive correlation between the proportion of Cape Verdeans and percentage of population with at least 3rd grade education in the United States with a correlation coefficient (R) of 0.064 and weighted average of 96.6%. Similarly, the statistical analysis conducted on geographies consisting of 470,094,148 people shows a moderate positive correlation between the proportion of Africans and percentage of population with at least 3rd grade education in the United States with a correlation coefficient (R) of 0.440 and weighted average of 97.6%, a difference of 1.0%.
3rd Grade Correlation Summary
| Measurement | Cape Verdean | African |
| Minimum | 93.9% | 93.7% |
| Maximum | 100.0% | 100.0% |
| Range | 6.1% | 6.3% |
| Mean | 97.4% | 98.4% |
| Median | 97.5% | 98.5% |
| Interquartile 25% (IQ1) | 96.2% | 97.7% |
| Interquartile 75% (IQ3) | 98.4% | 100.0% |
| Interquartile Range (IQR) | 2.2% | 2.3% |
| Standard Deviation (Sample) | 1.6% | 1.4% |
| Standard Deviation (Population) | 1.6% | 1.4% |
Similar Demographics by 3rd Grade
Demographics Similar to Cape Verdeans by 3rd Grade
In terms of 3rd grade, the demographic groups most similar to Cape Verdeans are Nicaraguan (96.7%, a difference of 0.030%), Immigrants from Haiti (96.7%, a difference of 0.030%), Sri Lankan (96.7%, a difference of 0.030%), Immigrants from Guyana (96.6%, a difference of 0.030%), and Immigrants from Laos (96.6%, a difference of 0.040%).
| Demographics | Rating | Rank | 3rd Grade |
| Ecuadorians | 0.0 /100 | #303 | Tragic 96.7% |
| Immigrants | Caribbean | 0.0 /100 | #304 | Tragic 96.7% |
| Central American Indians | 0.0 /100 | #305 | Tragic 96.7% |
| Guyanese | 0.0 /100 | #306 | Tragic 96.7% |
| Nicaraguans | 0.0 /100 | #307 | Tragic 96.7% |
| Immigrants | Haiti | 0.0 /100 | #308 | Tragic 96.7% |
| Sri Lankans | 0.0 /100 | #309 | Tragic 96.7% |
| Cape Verdeans | 0.0 /100 | #310 | Tragic 96.6% |
| Immigrants | Guyana | 0.0 /100 | #311 | Tragic 96.6% |
| Immigrants | Laos | 0.0 /100 | #312 | Tragic 96.6% |
| Immigrants | Ecuador | 0.0 /100 | #313 | Tragic 96.6% |
| Belizeans | 0.0 /100 | #314 | Tragic 96.6% |
| Immigrants | Azores | 0.0 /100 | #315 | Tragic 96.6% |
| Immigrants | Burma/Myanmar | 0.0 /100 | #316 | Tragic 96.6% |
| Immigrants | Bangladesh | 0.0 /100 | #317 | Tragic 96.6% |
Demographics Similar to Africans by 3rd Grade
In terms of 3rd grade, the demographic groups most similar to Africans are Paiute (97.6%, a difference of 0.010%), Immigrants from Chile (97.6%, a difference of 0.010%), Immigrants from Northern Africa (97.6%, a difference of 0.010%), Tohono O'odham (97.6%, a difference of 0.010%), and Immigrants from Southern Europe (97.6%, a difference of 0.020%).
| Demographics | Rating | Rank | 3rd Grade |
| Guamanians/Chamorros | 23.6 /100 | #198 | Fair 97.7% |
| Immigrants | Ukraine | 22.7 /100 | #199 | Fair 97.7% |
| Immigrants | Albania | 22.6 /100 | #200 | Fair 97.7% |
| Immigrants | Lebanon | 21.7 /100 | #201 | Fair 97.7% |
| Immigrants | Southern Europe | 17.7 /100 | #202 | Poor 97.6% |
| Paiute | 16.7 /100 | #203 | Poor 97.6% |
| Immigrants | Chile | 16.5 /100 | #204 | Poor 97.6% |
| Africans | 14.5 /100 | #205 | Poor 97.6% |
| Immigrants | Northern Africa | 13.0 /100 | #206 | Poor 97.6% |
| Tohono O'odham | 12.5 /100 | #207 | Poor 97.6% |
| Immigrants | Zaire | 11.9 /100 | #208 | Poor 97.6% |
| Costa Ricans | 9.6 /100 | #209 | Tragic 97.6% |
| Immigrants | Oceania | 9.5 /100 | #210 | Tragic 97.6% |
| Laotians | 9.4 /100 | #211 | Tragic 97.6% |
| Immigrants | Bahamas | 8.5 /100 | #212 | Tragic 97.6% |