Barbadian vs Trinidadian and Tobagonian 6th Grade
COMPARE
Barbadian
Trinidadian and Tobagonian
6th Grade
6th Grade Comparison
Barbadians
Trinidadians and Tobagonians
96.2%
6TH GRADE
0.0/ 100
METRIC RATING
286th/ 347
METRIC RANK
96.2%
6TH GRADE
0.1/ 100
METRIC RATING
281st/ 347
METRIC RANK
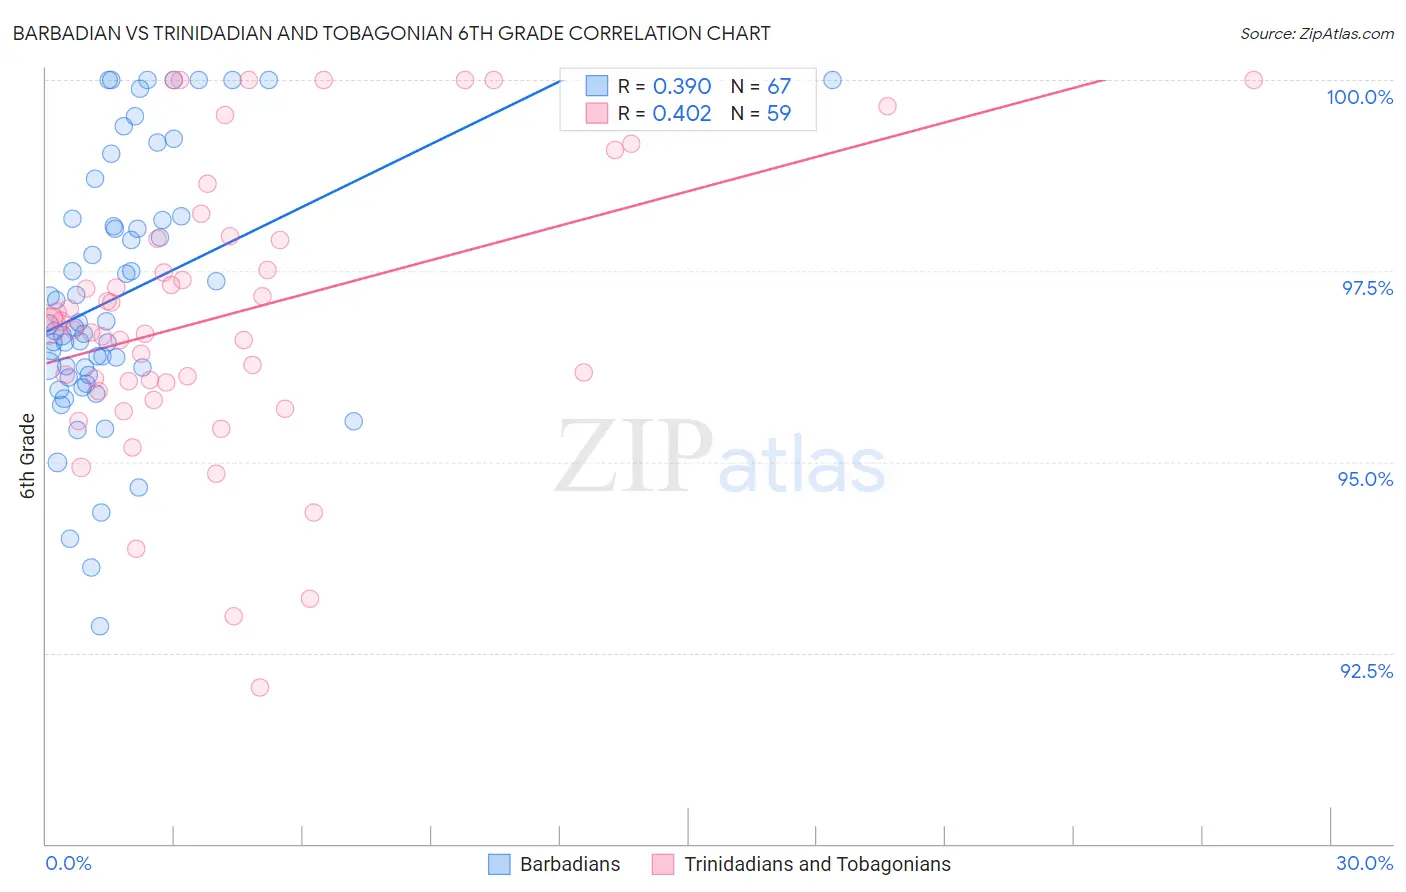
Barbadian vs Trinidadian and Tobagonian 6th Grade Correlation Chart
The statistical analysis conducted on geographies consisting of 141,304,590 people shows a mild positive correlation between the proportion of Barbadians and percentage of population with at least 6th grade education in the United States with a correlation coefficient (R) of 0.390 and weighted average of 96.2%. Similarly, the statistical analysis conducted on geographies consisting of 219,882,819 people shows a moderate positive correlation between the proportion of Trinidadians and Tobagonians and percentage of population with at least 6th grade education in the United States with a correlation coefficient (R) of 0.402 and weighted average of 96.2%, a difference of 0.060%.
6th Grade Correlation Summary
| Measurement | Barbadian | Trinidadian and Tobagonian |
| Minimum | 92.8% | 92.1% |
| Maximum | 100.0% | 100.0% |
| Range | 7.2% | 7.9% |
| Mean | 97.2% | 96.9% |
| Median | 96.8% | 96.8% |
| Interquartile 25% (IQ1) | 96.1% | 96.0% |
| Interquartile 75% (IQ3) | 98.2% | 97.9% |
| Interquartile Range (IQR) | 2.0% | 1.9% |
| Standard Deviation (Sample) | 1.7% | 1.8% |
| Standard Deviation (Population) | 1.7% | 1.8% |
Demographics Similar to Barbadians and Trinidadians and Tobagonians by 6th Grade
In terms of 6th grade, the demographic groups most similar to Barbadians are Immigrants from Trinidad and Tobago (96.2%, a difference of 0.010%), Malaysian (96.2%, a difference of 0.020%), Somali (96.2%, a difference of 0.030%), Fijian (96.2%, a difference of 0.040%), and Immigrants from Eritrea (96.1%, a difference of 0.040%). Similarly, the demographic groups most similar to Trinidadians and Tobagonians are Immigrants from Peru (96.2%, a difference of 0.0%), Immigrants from Afghanistan (96.2%, a difference of 0.0%), Houma (96.2%, a difference of 0.0%), Cuban (96.2%, a difference of 0.010%), and Immigrants from Western Africa (96.3%, a difference of 0.020%).
| Demographics | Rating | Rank | 6th Grade |
| Immigrants | Cameroon | 0.1 /100 | #273 | Tragic 96.3% |
| Immigrants | Philippines | 0.1 /100 | #274 | Tragic 96.3% |
| Immigrants | Ghana | 0.1 /100 | #275 | Tragic 96.3% |
| Yaqui | 0.1 /100 | #276 | Tragic 96.3% |
| Immigrants | Western Africa | 0.1 /100 | #277 | Tragic 96.3% |
| Immigrants | Thailand | 0.1 /100 | #278 | Tragic 96.3% |
| Immigrants | Peru | 0.1 /100 | #279 | Tragic 96.2% |
| Immigrants | Afghanistan | 0.1 /100 | #280 | Tragic 96.2% |
| Trinidadians and Tobagonians | 0.1 /100 | #281 | Tragic 96.2% |
| Houma | 0.1 /100 | #282 | Tragic 96.2% |
| Cubans | 0.1 /100 | #283 | Tragic 96.2% |
| Fijians | 0.1 /100 | #284 | Tragic 96.2% |
| Somalis | 0.1 /100 | #285 | Tragic 96.2% |
| Barbadians | 0.0 /100 | #286 | Tragic 96.2% |
| Immigrants | Trinidad and Tobago | 0.0 /100 | #287 | Tragic 96.2% |
| Malaysians | 0.0 /100 | #288 | Tragic 96.2% |
| Immigrants | Eritrea | 0.0 /100 | #289 | Tragic 96.1% |
| Immigrants | Somalia | 0.0 /100 | #290 | Tragic 96.1% |
| Immigrants | St. Vincent and the Grenadines | 0.0 /100 | #291 | Tragic 96.1% |
| Immigrants | Barbados | 0.0 /100 | #292 | Tragic 96.1% |
| Immigrants | West Indies | 0.0 /100 | #293 | Tragic 96.1% |