Immigrants from Colombia vs Paraguayan 6th Grade
COMPARE
Immigrants from Colombia
Paraguayan
6th Grade
6th Grade Comparison
Immigrants from Colombia
Paraguayans
96.4%
6TH GRADE
0.3/ 100
METRIC RATING
263rd/ 347
METRIC RANK
96.9%
6TH GRADE
26.6/ 100
METRIC RATING
193rd/ 347
METRIC RANK
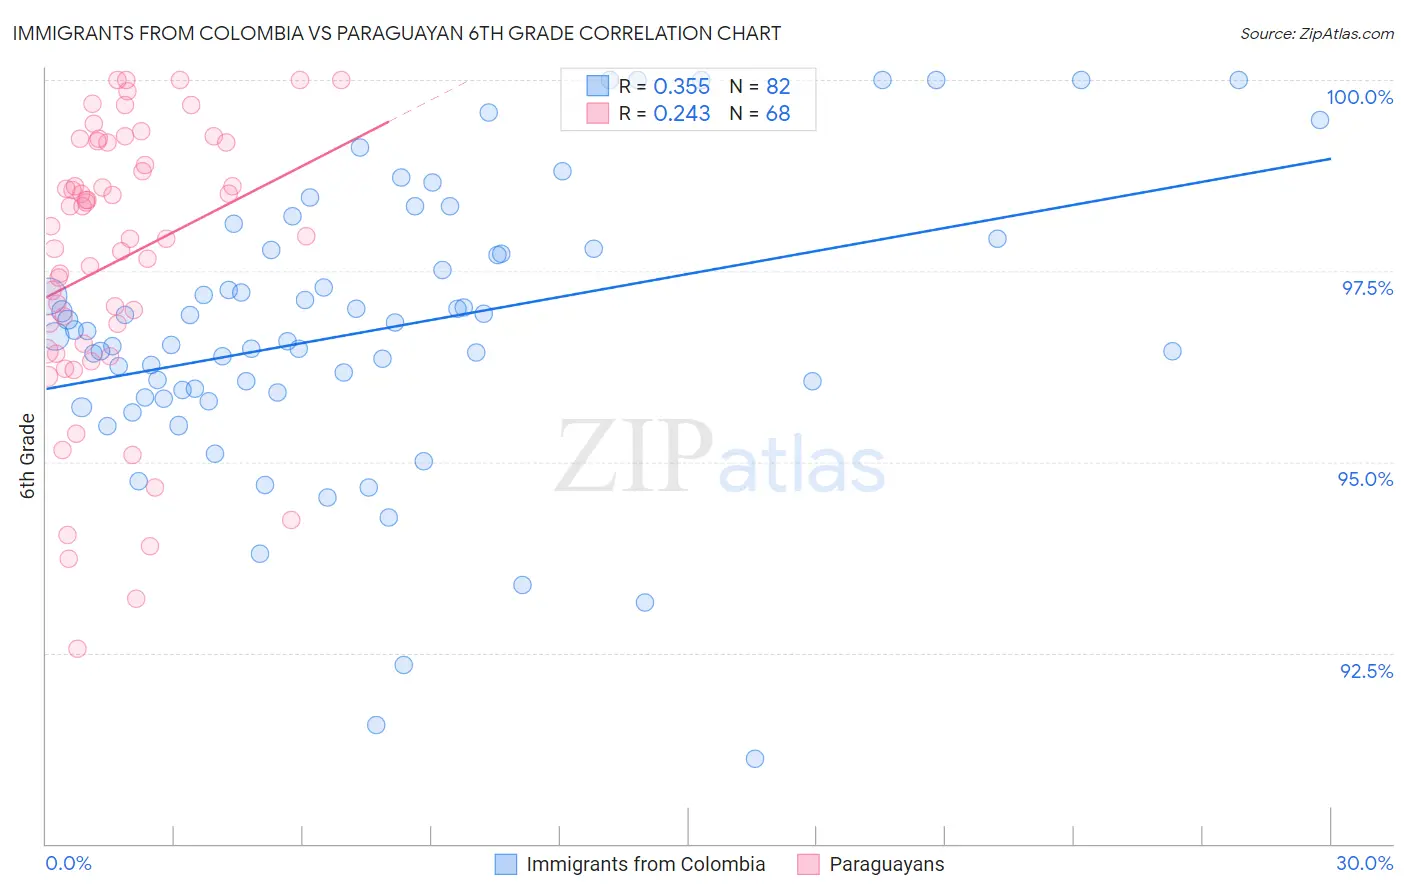
Immigrants from Colombia vs Paraguayan 6th Grade Correlation Chart
The statistical analysis conducted on geographies consisting of 378,598,469 people shows a mild positive correlation between the proportion of Immigrants from Colombia and percentage of population with at least 6th grade education in the United States with a correlation coefficient (R) of 0.355 and weighted average of 96.4%. Similarly, the statistical analysis conducted on geographies consisting of 95,115,093 people shows a weak positive correlation between the proportion of Paraguayans and percentage of population with at least 6th grade education in the United States with a correlation coefficient (R) of 0.243 and weighted average of 96.9%, a difference of 0.57%.
6th Grade Correlation Summary
| Measurement | Immigrants from Colombia | Paraguayan |
| Minimum | 91.1% | 92.6% |
| Maximum | 100.0% | 100.0% |
| Range | 8.9% | 7.4% |
| Mean | 96.7% | 97.6% |
| Median | 96.7% | 98.0% |
| Interquartile 25% (IQ1) | 95.9% | 96.5% |
| Interquartile 75% (IQ3) | 97.8% | 99.2% |
| Interquartile Range (IQR) | 1.9% | 2.7% |
| Standard Deviation (Sample) | 1.9% | 1.8% |
| Standard Deviation (Population) | 1.8% | 1.8% |
Similar Demographics by 6th Grade
Demographics Similar to Immigrants from Colombia by 6th Grade
In terms of 6th grade, the demographic groups most similar to Immigrants from Colombia are Armenian (96.4%, a difference of 0.0%), Immigrants from Nigeria (96.4%, a difference of 0.010%), Immigrants from Jamaica (96.4%, a difference of 0.010%), Ghanaian (96.4%, a difference of 0.020%), and Afghan (96.4%, a difference of 0.020%).
| Demographics | Rating | Rank | 6th Grade |
| U.S. Virgin Islanders | 0.5 /100 | #256 | Tragic 96.5% |
| Taiwanese | 0.5 /100 | #257 | Tragic 96.5% |
| Immigrants | China | 0.4 /100 | #258 | Tragic 96.4% |
| South Americans | 0.4 /100 | #259 | Tragic 96.4% |
| Peruvians | 0.4 /100 | #260 | Tragic 96.4% |
| Immigrants | Sierra Leone | 0.4 /100 | #261 | Tragic 96.4% |
| Immigrants | Nigeria | 0.3 /100 | #262 | Tragic 96.4% |
| Immigrants | Colombia | 0.3 /100 | #263 | Tragic 96.4% |
| Armenians | 0.3 /100 | #264 | Tragic 96.4% |
| Immigrants | Jamaica | 0.2 /100 | #265 | Tragic 96.4% |
| Ghanaians | 0.2 /100 | #266 | Tragic 96.4% |
| Afghans | 0.2 /100 | #267 | Tragic 96.4% |
| Immigrants | Uzbekistan | 0.2 /100 | #268 | Tragic 96.3% |
| West Indians | 0.2 /100 | #269 | Tragic 96.3% |
| Immigrants | South America | 0.2 /100 | #270 | Tragic 96.3% |
Demographics Similar to Paraguayans by 6th Grade
In terms of 6th grade, the demographic groups most similar to Paraguayans are Panamanian (96.9%, a difference of 0.0%), Hawaiian (96.9%, a difference of 0.0%), Dutch West Indian (96.9%, a difference of 0.010%), Immigrants from Lebanon (96.9%, a difference of 0.010%), and Immigrants from Brazil (96.9%, a difference of 0.010%).
| Demographics | Rating | Rank | 6th Grade |
| Immigrants | Egypt | 31.4 /100 | #186 | Fair 97.0% |
| Guamanians/Chamorros | 30.6 /100 | #187 | Fair 97.0% |
| Immigrants | Argentina | 30.4 /100 | #188 | Fair 97.0% |
| Blacks/African Americans | 30.2 /100 | #189 | Fair 97.0% |
| Dutch West Indians | 28.3 /100 | #190 | Fair 96.9% |
| Panamanians | 27.3 /100 | #191 | Fair 96.9% |
| Hawaiians | 27.0 /100 | #192 | Fair 96.9% |
| Paraguayans | 26.6 /100 | #193 | Fair 96.9% |
| Immigrants | Lebanon | 25.6 /100 | #194 | Fair 96.9% |
| Immigrants | Brazil | 25.5 /100 | #195 | Fair 96.9% |
| Immigrants | Uganda | 21.2 /100 | #196 | Fair 96.9% |
| Brazilians | 20.1 /100 | #197 | Fair 96.9% |
| Immigrants | Albania | 18.8 /100 | #198 | Poor 96.9% |
| Immigrants | Northern Africa | 15.7 /100 | #199 | Poor 96.9% |
| Africans | 14.8 /100 | #200 | Poor 96.9% |