Immigrants from China vs Immigrants from Vietnam Bachelor's Degree
COMPARE
Immigrants from China
Immigrants from Vietnam
Bachelor's Degree
Bachelor's Degree Comparison
Immigrants from China
Immigrants from Vietnam
48.4%
BACHELOR'S DEGREE
100.0/ 100
METRIC RATING
12th/ 347
METRIC RANK
37.1%
BACHELOR'S DEGREE
32.1/ 100
METRIC RATING
192nd/ 347
METRIC RANK
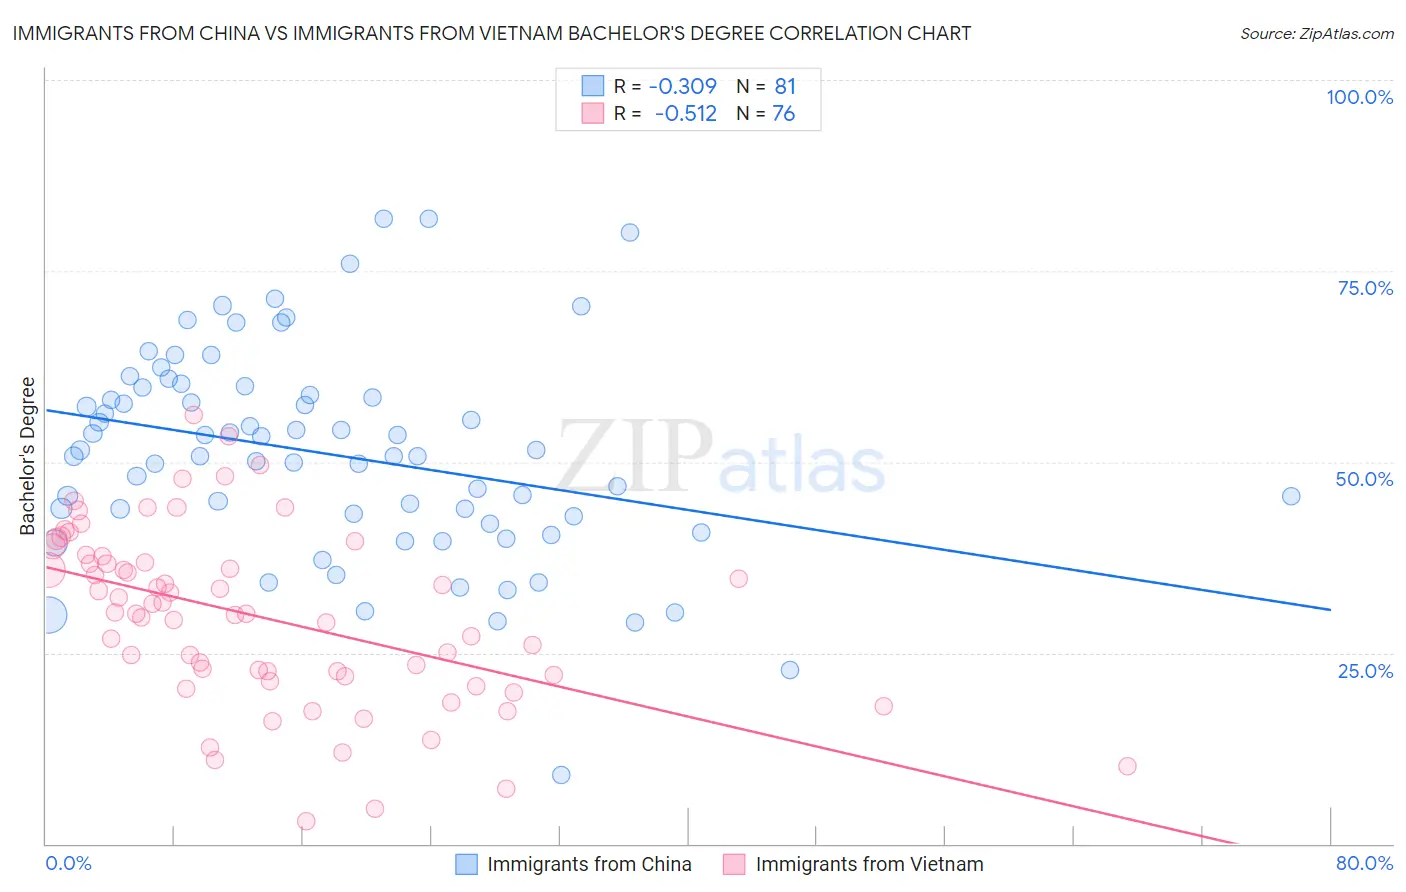
Immigrants from China vs Immigrants from Vietnam Bachelor's Degree Correlation Chart
The statistical analysis conducted on geographies consisting of 457,002,044 people shows a mild negative correlation between the proportion of Immigrants from China and percentage of population with at least bachelor's degree education in the United States with a correlation coefficient (R) of -0.309 and weighted average of 48.4%. Similarly, the statistical analysis conducted on geographies consisting of 404,813,779 people shows a substantial negative correlation between the proportion of Immigrants from Vietnam and percentage of population with at least bachelor's degree education in the United States with a correlation coefficient (R) of -0.512 and weighted average of 37.1%, a difference of 30.4%.
Bachelor's Degree Correlation Summary
| Measurement | Immigrants from China | Immigrants from Vietnam |
| Minimum | 9.0% | 2.9% |
| Maximum | 81.9% | 56.2% |
| Range | 72.9% | 53.3% |
| Mean | 51.0% | 29.7% |
| Median | 50.8% | 30.2% |
| Interquartile 25% (IQ1) | 42.4% | 22.0% |
| Interquartile 75% (IQ3) | 59.2% | 37.2% |
| Interquartile Range (IQR) | 16.8% | 15.2% |
| Standard Deviation (Sample) | 13.7% | 11.5% |
| Standard Deviation (Population) | 13.7% | 11.4% |
Similar Demographics by Bachelor's Degree
Demographics Similar to Immigrants from China by Bachelor's Degree
In terms of bachelor's degree, the demographic groups most similar to Immigrants from China are Immigrants from South Central Asia (48.3%, a difference of 0.14%), Immigrants from Australia (48.5%, a difference of 0.18%), Immigrants from Hong Kong (48.2%, a difference of 0.42%), Immigrants from Eastern Asia (48.1%, a difference of 0.56%), and Soviet Union (47.9%, a difference of 1.0%).
| Demographics | Rating | Rank | Bachelor's Degree |
| Iranians | 100.0 /100 | #5 | Exceptional 51.0% |
| Okinawans | 100.0 /100 | #6 | Exceptional 50.5% |
| Immigrants | Iran | 100.0 /100 | #7 | Exceptional 50.3% |
| Thais | 100.0 /100 | #8 | Exceptional 50.1% |
| Immigrants | Israel | 100.0 /100 | #9 | Exceptional 50.0% |
| Cypriots | 100.0 /100 | #10 | Exceptional 49.0% |
| Immigrants | Australia | 100.0 /100 | #11 | Exceptional 48.5% |
| Immigrants | China | 100.0 /100 | #12 | Exceptional 48.4% |
| Immigrants | South Central Asia | 100.0 /100 | #13 | Exceptional 48.3% |
| Immigrants | Hong Kong | 100.0 /100 | #14 | Exceptional 48.2% |
| Immigrants | Eastern Asia | 100.0 /100 | #15 | Exceptional 48.1% |
| Soviet Union | 100.0 /100 | #16 | Exceptional 47.9% |
| Eastern Europeans | 100.0 /100 | #17 | Exceptional 47.5% |
| Indians (Asian) | 100.0 /100 | #18 | Exceptional 47.4% |
| Cambodians | 100.0 /100 | #19 | Exceptional 47.2% |
Demographics Similar to Immigrants from Vietnam by Bachelor's Degree
In terms of bachelor's degree, the demographic groups most similar to Immigrants from Vietnam are Yugoslavian (37.1%, a difference of 0.060%), Nigerian (37.2%, a difference of 0.20%), Swiss (37.2%, a difference of 0.22%), Belgian (37.0%, a difference of 0.25%), and Korean (37.0%, a difference of 0.27%).
| Demographics | Rating | Rank | Bachelor's Degree |
| Immigrants | Peru | 41.3 /100 | #185 | Average 37.5% |
| Norwegians | 40.4 /100 | #186 | Average 37.5% |
| English | 39.7 /100 | #187 | Fair 37.4% |
| Immigrants | Oceania | 37.3 /100 | #188 | Fair 37.3% |
| Slovaks | 36.9 /100 | #189 | Fair 37.3% |
| Swiss | 34.1 /100 | #190 | Fair 37.2% |
| Nigerians | 33.9 /100 | #191 | Fair 37.2% |
| Immigrants | Vietnam | 32.1 /100 | #192 | Fair 37.1% |
| Yugoslavians | 31.5 /100 | #193 | Fair 37.1% |
| Belgians | 29.9 /100 | #194 | Fair 37.0% |
| Koreans | 29.8 /100 | #195 | Fair 37.0% |
| Celtics | 29.5 /100 | #196 | Fair 37.0% |
| Czechoslovakians | 29.2 /100 | #197 | Fair 37.0% |
| Welsh | 29.1 /100 | #198 | Fair 37.0% |
| Immigrants | Costa Rica | 27.4 /100 | #199 | Fair 36.9% |