Navajo vs Immigrants from Vietnam Bachelor's Degree
COMPARE
Navajo
Immigrants from Vietnam
Bachelor's Degree
Bachelor's Degree Comparison
Navajo
Immigrants from Vietnam
23.6%
BACHELOR'S DEGREE
0.0/ 100
METRIC RATING
344th/ 347
METRIC RANK
37.1%
BACHELOR'S DEGREE
32.1/ 100
METRIC RATING
192nd/ 347
METRIC RANK
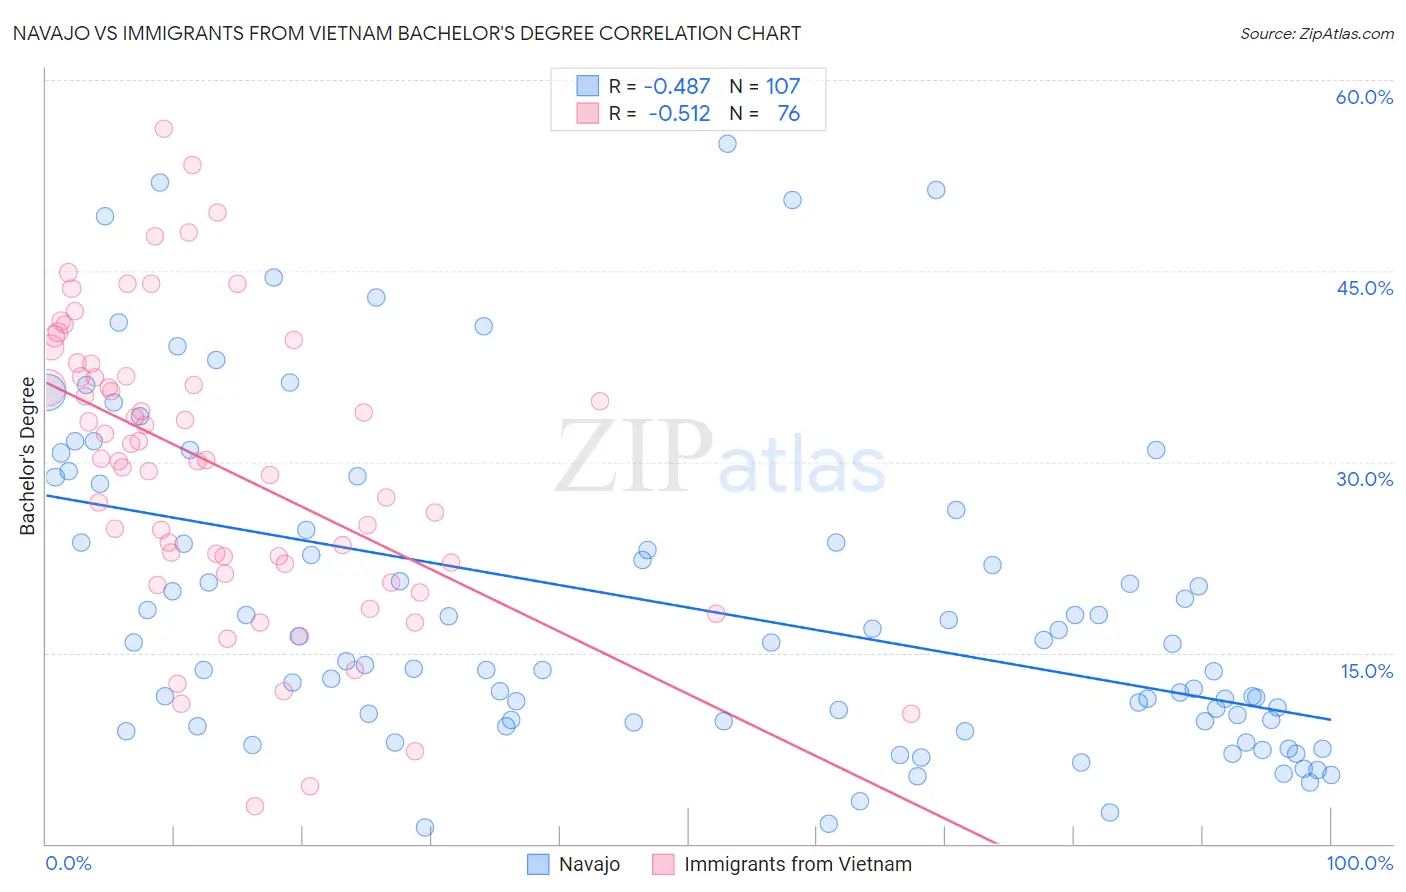
Navajo vs Immigrants from Vietnam Bachelor's Degree Correlation Chart
The statistical analysis conducted on geographies consisting of 224,864,569 people shows a moderate negative correlation between the proportion of Navajo and percentage of population with at least bachelor's degree education in the United States with a correlation coefficient (R) of -0.487 and weighted average of 23.6%. Similarly, the statistical analysis conducted on geographies consisting of 404,813,779 people shows a substantial negative correlation between the proportion of Immigrants from Vietnam and percentage of population with at least bachelor's degree education in the United States with a correlation coefficient (R) of -0.512 and weighted average of 37.1%, a difference of 57.3%.
Bachelor's Degree Correlation Summary
| Measurement | Navajo | Immigrants from Vietnam |
| Minimum | 1.3% | 2.9% |
| Maximum | 54.9% | 56.2% |
| Range | 53.6% | 53.3% |
| Mean | 18.7% | 29.7% |
| Median | 14.3% | 30.2% |
| Interquartile 25% (IQ1) | 9.6% | 22.0% |
| Interquartile 75% (IQ3) | 24.7% | 37.2% |
| Interquartile Range (IQR) | 15.1% | 15.2% |
| Standard Deviation (Sample) | 12.6% | 11.5% |
| Standard Deviation (Population) | 12.5% | 11.4% |
Similar Demographics by Bachelor's Degree
Demographics Similar to Navajo by Bachelor's Degree
In terms of bachelor's degree, the demographic groups most similar to Navajo are Pima (23.2%, a difference of 1.8%), Tohono O'odham (24.4%, a difference of 3.4%), Yakama (24.5%, a difference of 3.6%), Yuman (24.5%, a difference of 3.9%), and Lumbee (24.8%, a difference of 4.8%).
| Demographics | Rating | Rank | Bachelor's Degree |
| Mexicans | 0.0 /100 | #333 | Tragic 27.1% |
| Arapaho | 0.0 /100 | #334 | Tragic 26.6% |
| Natives/Alaskans | 0.0 /100 | #335 | Tragic 26.3% |
| Immigrants | Mexico | 0.0 /100 | #336 | Tragic 26.1% |
| Inupiat | 0.0 /100 | #337 | Tragic 25.8% |
| Pueblo | 0.0 /100 | #338 | Tragic 25.5% |
| Hopi | 0.0 /100 | #339 | Tragic 25.3% |
| Lumbee | 0.0 /100 | #340 | Tragic 24.8% |
| Yuman | 0.0 /100 | #341 | Tragic 24.5% |
| Yakama | 0.0 /100 | #342 | Tragic 24.5% |
| Tohono O'odham | 0.0 /100 | #343 | Tragic 24.4% |
| Navajo | 0.0 /100 | #344 | Tragic 23.6% |
| Pima | 0.0 /100 | #345 | Tragic 23.2% |
| Houma | 0.0 /100 | #346 | Tragic 21.4% |
| Yup'ik | 0.0 /100 | #347 | Tragic 19.4% |
Demographics Similar to Immigrants from Vietnam by Bachelor's Degree
In terms of bachelor's degree, the demographic groups most similar to Immigrants from Vietnam are Yugoslavian (37.1%, a difference of 0.060%), Nigerian (37.2%, a difference of 0.20%), Swiss (37.2%, a difference of 0.22%), Belgian (37.0%, a difference of 0.25%), and Korean (37.0%, a difference of 0.27%).
| Demographics | Rating | Rank | Bachelor's Degree |
| Immigrants | Peru | 41.3 /100 | #185 | Average 37.5% |
| Norwegians | 40.4 /100 | #186 | Average 37.5% |
| English | 39.7 /100 | #187 | Fair 37.4% |
| Immigrants | Oceania | 37.3 /100 | #188 | Fair 37.3% |
| Slovaks | 36.9 /100 | #189 | Fair 37.3% |
| Swiss | 34.1 /100 | #190 | Fair 37.2% |
| Nigerians | 33.9 /100 | #191 | Fair 37.2% |
| Immigrants | Vietnam | 32.1 /100 | #192 | Fair 37.1% |
| Yugoslavians | 31.5 /100 | #193 | Fair 37.1% |
| Belgians | 29.9 /100 | #194 | Fair 37.0% |
| Koreans | 29.8 /100 | #195 | Fair 37.0% |
| Celtics | 29.5 /100 | #196 | Fair 37.0% |
| Czechoslovakians | 29.2 /100 | #197 | Fair 37.0% |
| Welsh | 29.1 /100 | #198 | Fair 37.0% |
| Immigrants | Costa Rica | 27.4 /100 | #199 | Fair 36.9% |