Immigrants from Eastern Europe vs Immigrants from Vietnam Bachelor's Degree
COMPARE
Immigrants from Eastern Europe
Immigrants from Vietnam
Bachelor's Degree
Bachelor's Degree Comparison
Immigrants from Eastern Europe
Immigrants from Vietnam
42.5%
BACHELOR'S DEGREE
99.4/ 100
METRIC RATING
77th/ 347
METRIC RANK
37.1%
BACHELOR'S DEGREE
32.1/ 100
METRIC RATING
192nd/ 347
METRIC RANK
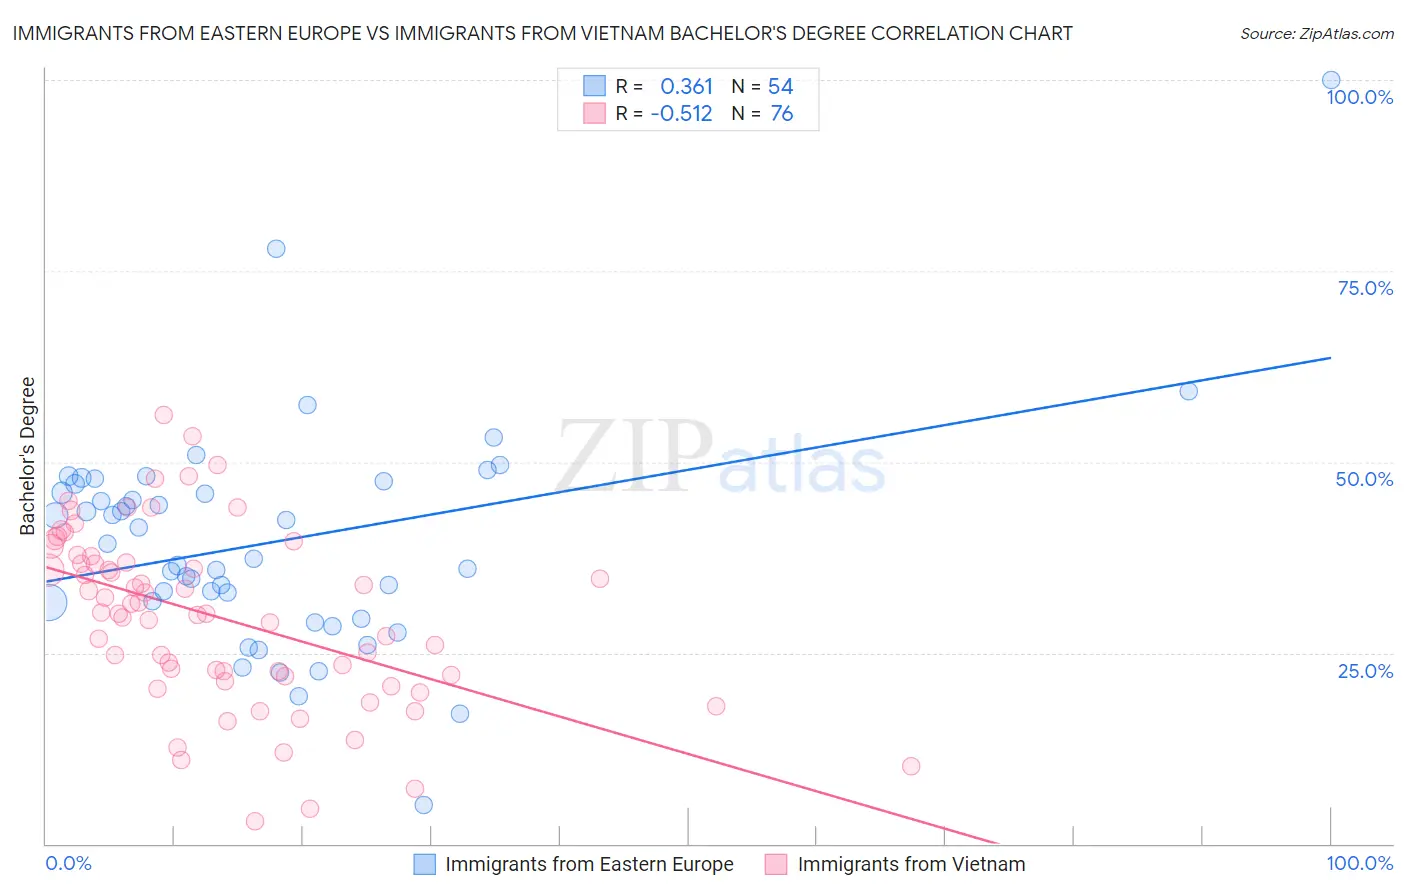
Immigrants from Eastern Europe vs Immigrants from Vietnam Bachelor's Degree Correlation Chart
The statistical analysis conducted on geographies consisting of 475,819,217 people shows a mild positive correlation between the proportion of Immigrants from Eastern Europe and percentage of population with at least bachelor's degree education in the United States with a correlation coefficient (R) of 0.361 and weighted average of 42.5%. Similarly, the statistical analysis conducted on geographies consisting of 404,813,779 people shows a substantial negative correlation between the proportion of Immigrants from Vietnam and percentage of population with at least bachelor's degree education in the United States with a correlation coefficient (R) of -0.512 and weighted average of 37.1%, a difference of 14.4%.
Bachelor's Degree Correlation Summary
| Measurement | Immigrants from Eastern Europe | Immigrants from Vietnam |
| Minimum | 5.0% | 2.9% |
| Maximum | 100.0% | 56.2% |
| Range | 95.0% | 53.3% |
| Mean | 39.5% | 29.7% |
| Median | 38.3% | 30.2% |
| Interquartile 25% (IQ1) | 31.6% | 22.0% |
| Interquartile 75% (IQ3) | 47.1% | 37.2% |
| Interquartile Range (IQR) | 15.5% | 15.2% |
| Standard Deviation (Sample) | 14.7% | 11.5% |
| Standard Deviation (Population) | 14.5% | 11.4% |
Similar Demographics by Bachelor's Degree
Demographics Similar to Immigrants from Eastern Europe by Bachelor's Degree
In terms of bachelor's degree, the demographic groups most similar to Immigrants from Eastern Europe are Immigrants from Ethiopia (42.5%, a difference of 0.060%), Immigrants from Egypt (42.6%, a difference of 0.18%), Immigrants from Zimbabwe (42.6%, a difference of 0.20%), Immigrants from Lebanon (42.4%, a difference of 0.23%), and Bhutanese (42.7%, a difference of 0.41%).
| Demographics | Rating | Rank | Bachelor's Degree |
| Immigrants | Romania | 99.6 /100 | #70 | Exceptional 42.9% |
| Immigrants | Argentina | 99.6 /100 | #71 | Exceptional 42.8% |
| Ethiopians | 99.5 /100 | #72 | Exceptional 42.8% |
| Immigrants | Uzbekistan | 99.5 /100 | #73 | Exceptional 42.8% |
| Bhutanese | 99.5 /100 | #74 | Exceptional 42.7% |
| Immigrants | Zimbabwe | 99.4 /100 | #75 | Exceptional 42.6% |
| Immigrants | Egypt | 99.4 /100 | #76 | Exceptional 42.6% |
| Immigrants | Eastern Europe | 99.4 /100 | #77 | Exceptional 42.5% |
| Immigrants | Ethiopia | 99.4 /100 | #78 | Exceptional 42.5% |
| Immigrants | Lebanon | 99.3 /100 | #79 | Exceptional 42.4% |
| Immigrants | Croatia | 99.2 /100 | #80 | Exceptional 42.3% |
| Immigrants | Hungary | 99.2 /100 | #81 | Exceptional 42.3% |
| Immigrants | Scotland | 99.2 /100 | #82 | Exceptional 42.3% |
| Armenians | 99.2 /100 | #83 | Exceptional 42.3% |
| Immigrants | Western Asia | 99.2 /100 | #84 | Exceptional 42.3% |
Demographics Similar to Immigrants from Vietnam by Bachelor's Degree
In terms of bachelor's degree, the demographic groups most similar to Immigrants from Vietnam are Yugoslavian (37.1%, a difference of 0.060%), Nigerian (37.2%, a difference of 0.20%), Swiss (37.2%, a difference of 0.22%), Belgian (37.0%, a difference of 0.25%), and Korean (37.0%, a difference of 0.27%).
| Demographics | Rating | Rank | Bachelor's Degree |
| Immigrants | Peru | 41.3 /100 | #185 | Average 37.5% |
| Norwegians | 40.4 /100 | #186 | Average 37.5% |
| English | 39.7 /100 | #187 | Fair 37.4% |
| Immigrants | Oceania | 37.3 /100 | #188 | Fair 37.3% |
| Slovaks | 36.9 /100 | #189 | Fair 37.3% |
| Swiss | 34.1 /100 | #190 | Fair 37.2% |
| Nigerians | 33.9 /100 | #191 | Fair 37.2% |
| Immigrants | Vietnam | 32.1 /100 | #192 | Fair 37.1% |
| Yugoslavians | 31.5 /100 | #193 | Fair 37.1% |
| Belgians | 29.9 /100 | #194 | Fair 37.0% |
| Koreans | 29.8 /100 | #195 | Fair 37.0% |
| Celtics | 29.5 /100 | #196 | Fair 37.0% |
| Czechoslovakians | 29.2 /100 | #197 | Fair 37.0% |
| Welsh | 29.1 /100 | #198 | Fair 37.0% |
| Immigrants | Costa Rica | 27.4 /100 | #199 | Fair 36.9% |