Croatian vs Immigrants from Vietnam Bachelor's Degree
COMPARE
Croatian
Immigrants from Vietnam
Bachelor's Degree
Bachelor's Degree Comparison
Croatians
Immigrants from Vietnam
40.6%
BACHELOR'S DEGREE
95.5/ 100
METRIC RATING
118th/ 347
METRIC RANK
37.1%
BACHELOR'S DEGREE
32.1/ 100
METRIC RATING
192nd/ 347
METRIC RANK
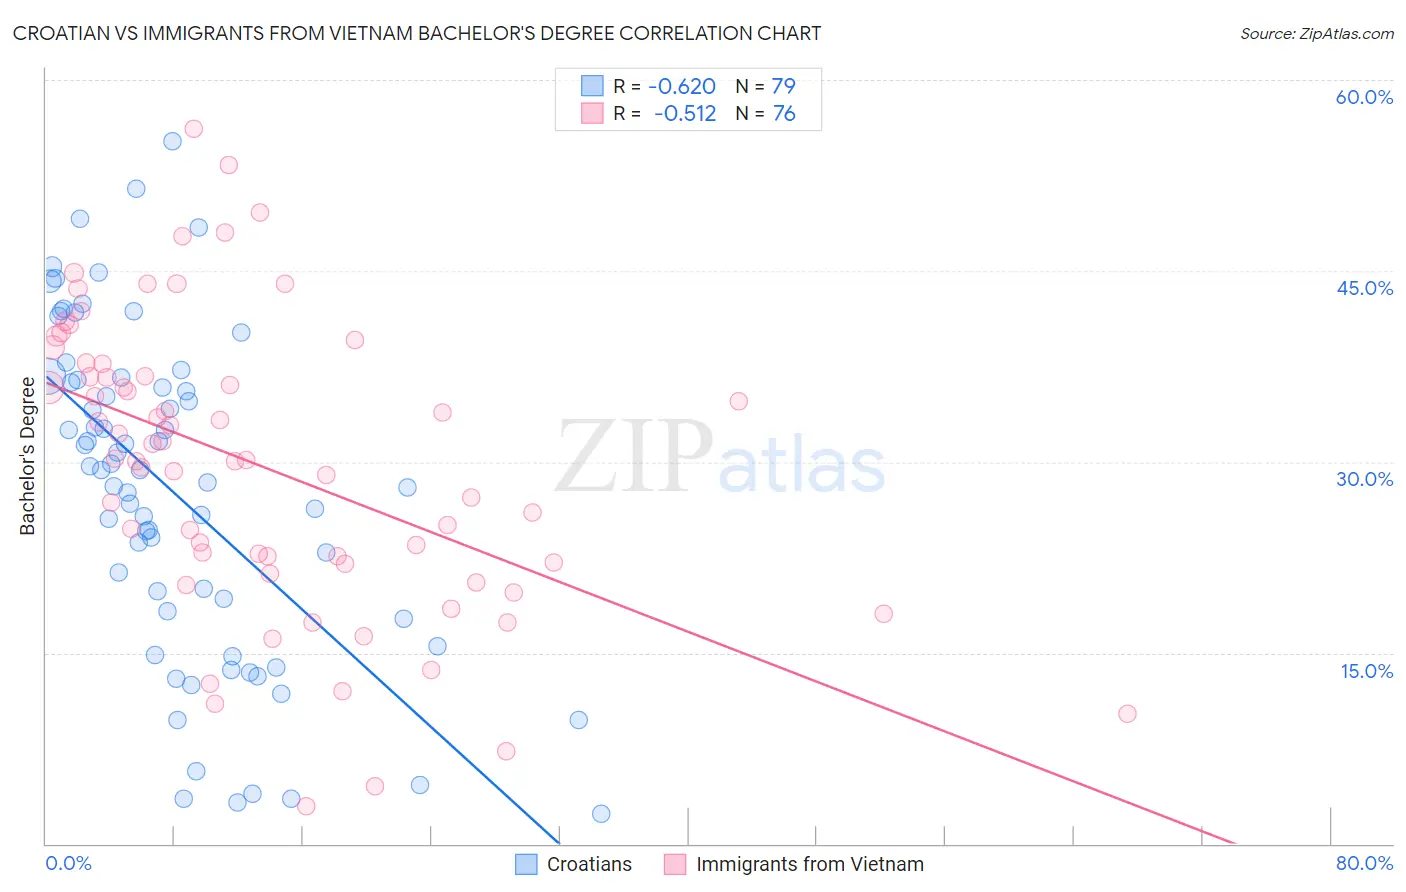
Croatian vs Immigrants from Vietnam Bachelor's Degree Correlation Chart
The statistical analysis conducted on geographies consisting of 375,700,831 people shows a significant negative correlation between the proportion of Croatians and percentage of population with at least bachelor's degree education in the United States with a correlation coefficient (R) of -0.620 and weighted average of 40.6%. Similarly, the statistical analysis conducted on geographies consisting of 404,813,779 people shows a substantial negative correlation between the proportion of Immigrants from Vietnam and percentage of population with at least bachelor's degree education in the United States with a correlation coefficient (R) of -0.512 and weighted average of 37.1%, a difference of 9.4%.
Bachelor's Degree Correlation Summary
| Measurement | Croatian | Immigrants from Vietnam |
| Minimum | 2.3% | 2.9% |
| Maximum | 55.2% | 56.2% |
| Range | 52.9% | 53.3% |
| Mean | 27.5% | 29.7% |
| Median | 29.3% | 30.2% |
| Interquartile 25% (IQ1) | 17.6% | 22.0% |
| Interquartile 75% (IQ3) | 36.5% | 37.2% |
| Interquartile Range (IQR) | 18.8% | 15.2% |
| Standard Deviation (Sample) | 12.8% | 11.5% |
| Standard Deviation (Population) | 12.8% | 11.4% |
Similar Demographics by Bachelor's Degree
Demographics Similar to Croatians by Bachelor's Degree
In terms of bachelor's degree, the demographic groups most similar to Croatians are Austrian (40.6%, a difference of 0.020%), Immigrants from Uganda (40.7%, a difference of 0.12%), Palestinian (40.7%, a difference of 0.17%), Immigrants from Syria (40.5%, a difference of 0.32%), and Venezuelan (40.5%, a difference of 0.39%).
| Demographics | Rating | Rank | Bachelor's Degree |
| Immigrants | Chile | 96.4 /100 | #111 | Exceptional 40.8% |
| Ugandans | 96.3 /100 | #112 | Exceptional 40.8% |
| Brazilians | 96.3 /100 | #113 | Exceptional 40.8% |
| Afghans | 96.2 /100 | #114 | Exceptional 40.8% |
| Palestinians | 95.8 /100 | #115 | Exceptional 40.7% |
| Immigrants | Uganda | 95.7 /100 | #116 | Exceptional 40.7% |
| Austrians | 95.5 /100 | #117 | Exceptional 40.6% |
| Croatians | 95.5 /100 | #118 | Exceptional 40.6% |
| Immigrants | Syria | 94.9 /100 | #119 | Exceptional 40.5% |
| Venezuelans | 94.7 /100 | #120 | Exceptional 40.5% |
| Moroccans | 94.6 /100 | #121 | Exceptional 40.5% |
| Immigrants | Albania | 94.4 /100 | #122 | Exceptional 40.4% |
| Lebanese | 94.3 /100 | #123 | Exceptional 40.4% |
| Immigrants | Eritrea | 94.3 /100 | #124 | Exceptional 40.4% |
| British | 94.2 /100 | #125 | Exceptional 40.4% |
Demographics Similar to Immigrants from Vietnam by Bachelor's Degree
In terms of bachelor's degree, the demographic groups most similar to Immigrants from Vietnam are Yugoslavian (37.1%, a difference of 0.060%), Nigerian (37.2%, a difference of 0.20%), Swiss (37.2%, a difference of 0.22%), Belgian (37.0%, a difference of 0.25%), and Korean (37.0%, a difference of 0.27%).
| Demographics | Rating | Rank | Bachelor's Degree |
| Immigrants | Peru | 41.3 /100 | #185 | Average 37.5% |
| Norwegians | 40.4 /100 | #186 | Average 37.5% |
| English | 39.7 /100 | #187 | Fair 37.4% |
| Immigrants | Oceania | 37.3 /100 | #188 | Fair 37.3% |
| Slovaks | 36.9 /100 | #189 | Fair 37.3% |
| Swiss | 34.1 /100 | #190 | Fair 37.2% |
| Nigerians | 33.9 /100 | #191 | Fair 37.2% |
| Immigrants | Vietnam | 32.1 /100 | #192 | Fair 37.1% |
| Yugoslavians | 31.5 /100 | #193 | Fair 37.1% |
| Belgians | 29.9 /100 | #194 | Fair 37.0% |
| Koreans | 29.8 /100 | #195 | Fair 37.0% |
| Celtics | 29.5 /100 | #196 | Fair 37.0% |
| Czechoslovakians | 29.2 /100 | #197 | Fair 37.0% |
| Welsh | 29.1 /100 | #198 | Fair 37.0% |
| Immigrants | Costa Rica | 27.4 /100 | #199 | Fair 36.9% |