Immigrants from China vs Immigrants from Kazakhstan Bachelor's Degree
COMPARE
Immigrants from China
Immigrants from Kazakhstan
Bachelor's Degree
Bachelor's Degree Comparison
Immigrants from China
Immigrants from Kazakhstan
48.4%
BACHELOR'S DEGREE
100.0/ 100
METRIC RATING
12th/ 347
METRIC RANK
43.4%
BACHELOR'S DEGREE
99.8/ 100
METRIC RATING
62nd/ 347
METRIC RANK
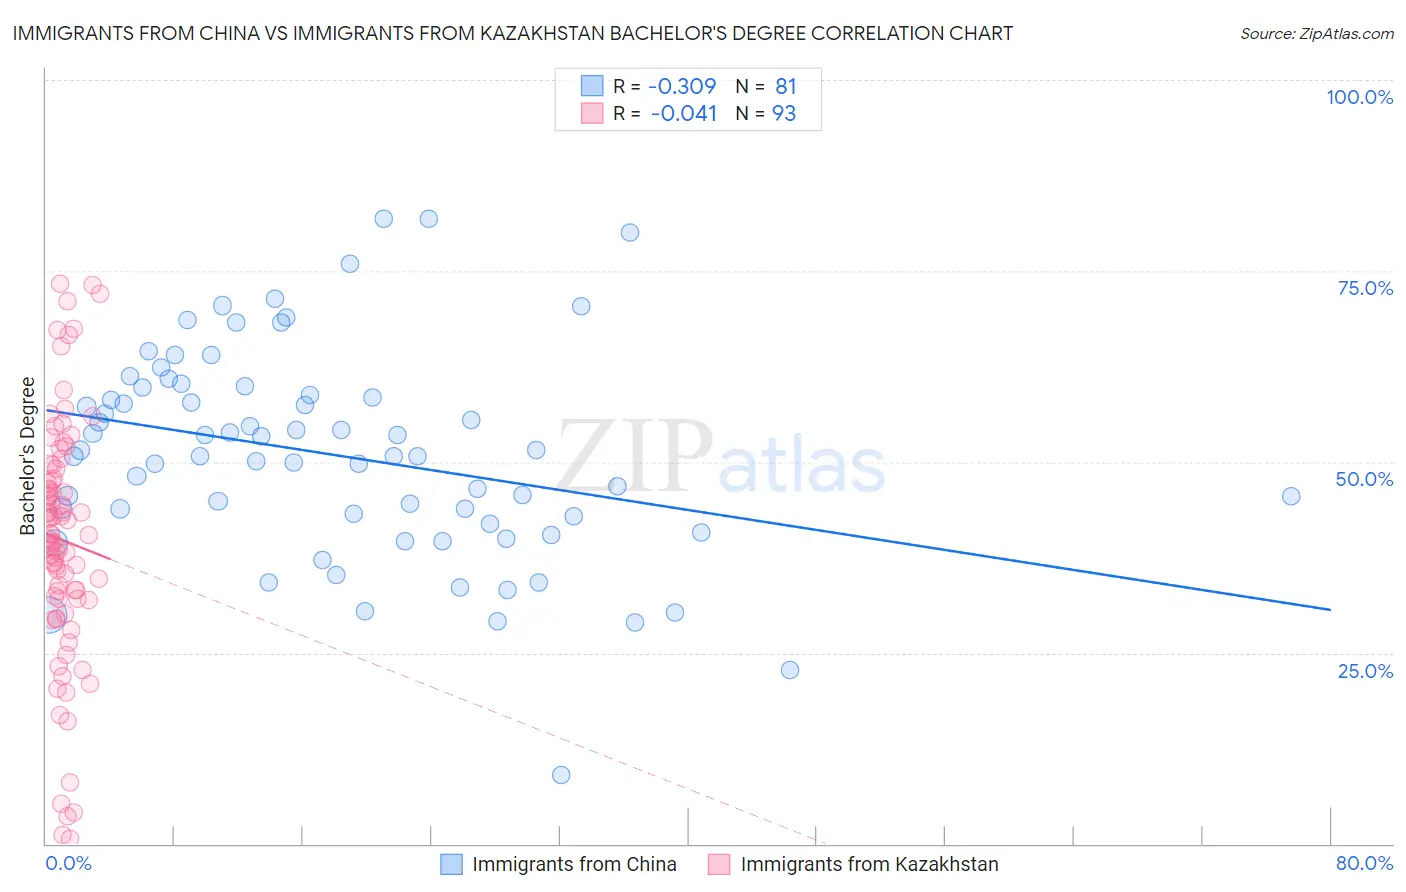
Immigrants from China vs Immigrants from Kazakhstan Bachelor's Degree Correlation Chart
The statistical analysis conducted on geographies consisting of 457,002,044 people shows a mild negative correlation between the proportion of Immigrants from China and percentage of population with at least bachelor's degree education in the United States with a correlation coefficient (R) of -0.309 and weighted average of 48.4%. Similarly, the statistical analysis conducted on geographies consisting of 124,444,388 people shows no correlation between the proportion of Immigrants from Kazakhstan and percentage of population with at least bachelor's degree education in the United States with a correlation coefficient (R) of -0.041 and weighted average of 43.4%, a difference of 11.5%.
Bachelor's Degree Correlation Summary
| Measurement | Immigrants from China | Immigrants from Kazakhstan |
| Minimum | 9.0% | 0.64% |
| Maximum | 81.9% | 73.4% |
| Range | 72.9% | 72.8% |
| Mean | 51.0% | 39.8% |
| Median | 50.8% | 40.4% |
| Interquartile 25% (IQ1) | 42.4% | 32.1% |
| Interquartile 75% (IQ3) | 59.2% | 48.4% |
| Interquartile Range (IQR) | 16.8% | 16.4% |
| Standard Deviation (Sample) | 13.7% | 15.8% |
| Standard Deviation (Population) | 13.7% | 15.7% |
Similar Demographics by Bachelor's Degree
Demographics Similar to Immigrants from China by Bachelor's Degree
In terms of bachelor's degree, the demographic groups most similar to Immigrants from China are Immigrants from South Central Asia (48.3%, a difference of 0.14%), Immigrants from Australia (48.5%, a difference of 0.18%), Immigrants from Hong Kong (48.2%, a difference of 0.42%), Immigrants from Eastern Asia (48.1%, a difference of 0.56%), and Soviet Union (47.9%, a difference of 1.0%).
| Demographics | Rating | Rank | Bachelor's Degree |
| Iranians | 100.0 /100 | #5 | Exceptional 51.0% |
| Okinawans | 100.0 /100 | #6 | Exceptional 50.5% |
| Immigrants | Iran | 100.0 /100 | #7 | Exceptional 50.3% |
| Thais | 100.0 /100 | #8 | Exceptional 50.1% |
| Immigrants | Israel | 100.0 /100 | #9 | Exceptional 50.0% |
| Cypriots | 100.0 /100 | #10 | Exceptional 49.0% |
| Immigrants | Australia | 100.0 /100 | #11 | Exceptional 48.5% |
| Immigrants | China | 100.0 /100 | #12 | Exceptional 48.4% |
| Immigrants | South Central Asia | 100.0 /100 | #13 | Exceptional 48.3% |
| Immigrants | Hong Kong | 100.0 /100 | #14 | Exceptional 48.2% |
| Immigrants | Eastern Asia | 100.0 /100 | #15 | Exceptional 48.1% |
| Soviet Union | 100.0 /100 | #16 | Exceptional 47.9% |
| Eastern Europeans | 100.0 /100 | #17 | Exceptional 47.5% |
| Indians (Asian) | 100.0 /100 | #18 | Exceptional 47.4% |
| Cambodians | 100.0 /100 | #19 | Exceptional 47.2% |
Demographics Similar to Immigrants from Kazakhstan by Bachelor's Degree
In terms of bachelor's degree, the demographic groups most similar to Immigrants from Kazakhstan are Immigrants from Europe (43.4%, a difference of 0.050%), South African (43.6%, a difference of 0.30%), Argentinean (43.3%, a difference of 0.32%), Zimbabwean (43.3%, a difference of 0.32%), and Immigrants from Netherlands (43.3%, a difference of 0.35%).
| Demographics | Rating | Rank | Bachelor's Degree |
| Immigrants | Bolivia | 99.9 /100 | #55 | Exceptional 44.2% |
| Immigrants | Serbia | 99.9 /100 | #56 | Exceptional 44.1% |
| Paraguayans | 99.9 /100 | #57 | Exceptional 44.0% |
| Immigrants | Czechoslovakia | 99.9 /100 | #58 | Exceptional 44.0% |
| Australians | 99.9 /100 | #59 | Exceptional 44.0% |
| New Zealanders | 99.9 /100 | #60 | Exceptional 44.0% |
| South Africans | 99.8 /100 | #61 | Exceptional 43.6% |
| Immigrants | Kazakhstan | 99.8 /100 | #62 | Exceptional 43.4% |
| Immigrants | Europe | 99.8 /100 | #63 | Exceptional 43.4% |
| Argentineans | 99.7 /100 | #64 | Exceptional 43.3% |
| Zimbabweans | 99.7 /100 | #65 | Exceptional 43.3% |
| Immigrants | Netherlands | 99.7 /100 | #66 | Exceptional 43.3% |
| Egyptians | 99.7 /100 | #67 | Exceptional 43.3% |
| Immigrants | Indonesia | 99.7 /100 | #68 | Exceptional 43.3% |
| Immigrants | Pakistan | 99.7 /100 | #69 | Exceptional 43.1% |