Fijian vs Immigrants from Vietnam Bachelor's Degree
COMPARE
Fijian
Immigrants from Vietnam
Bachelor's Degree
Bachelor's Degree Comparison
Fijians
Immigrants from Vietnam
28.7%
BACHELOR'S DEGREE
0.0/ 100
METRIC RATING
323rd/ 347
METRIC RANK
37.1%
BACHELOR'S DEGREE
32.1/ 100
METRIC RATING
192nd/ 347
METRIC RANK
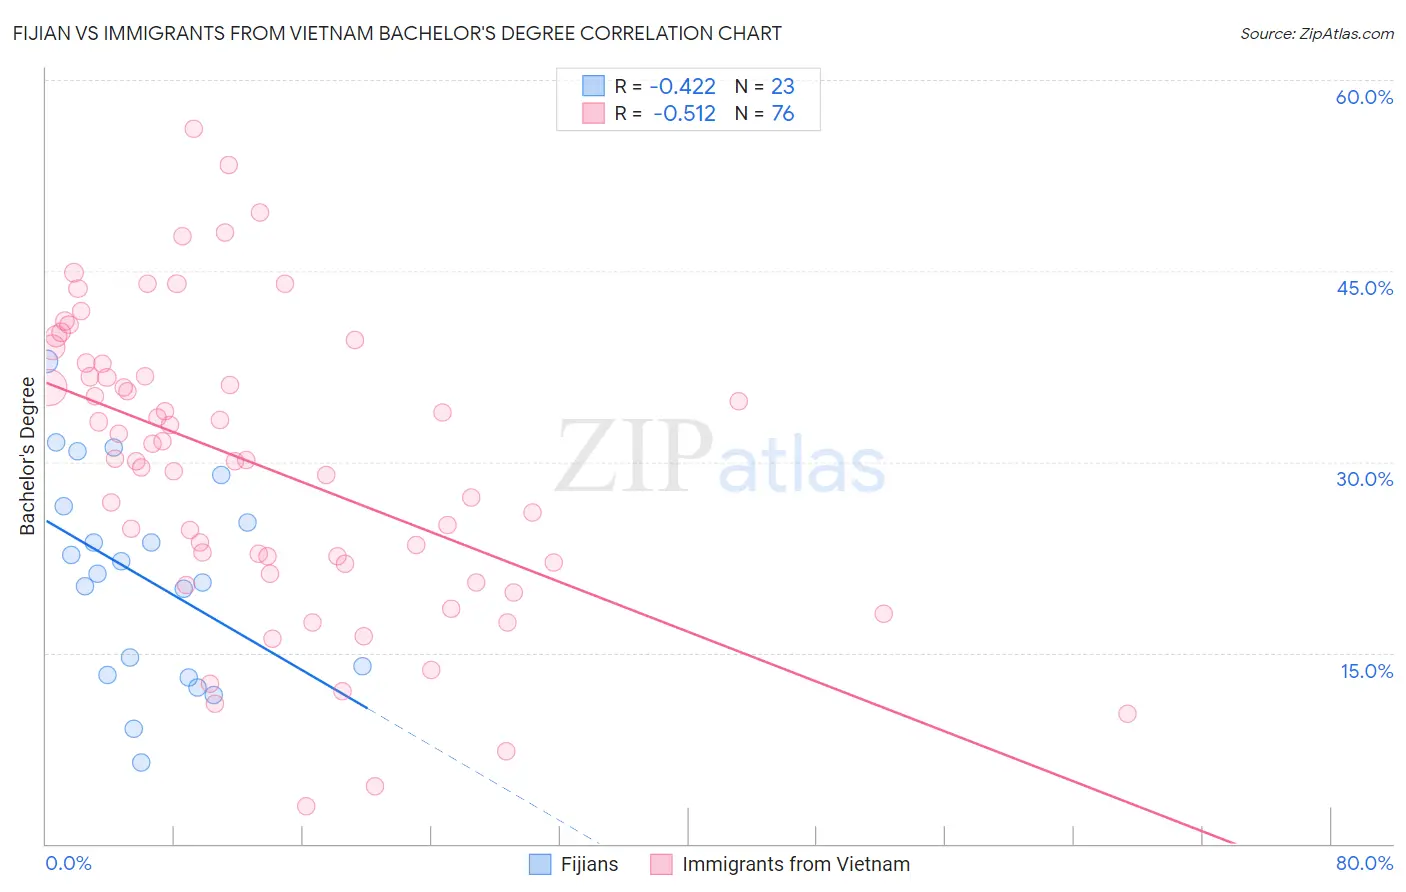
Fijian vs Immigrants from Vietnam Bachelor's Degree Correlation Chart
The statistical analysis conducted on geographies consisting of 55,947,282 people shows a moderate negative correlation between the proportion of Fijians and percentage of population with at least bachelor's degree education in the United States with a correlation coefficient (R) of -0.422 and weighted average of 28.7%. Similarly, the statistical analysis conducted on geographies consisting of 404,813,779 people shows a substantial negative correlation between the proportion of Immigrants from Vietnam and percentage of population with at least bachelor's degree education in the United States with a correlation coefficient (R) of -0.512 and weighted average of 37.1%, a difference of 29.3%.
Bachelor's Degree Correlation Summary
| Measurement | Fijian | Immigrants from Vietnam |
| Minimum | 6.4% | 2.9% |
| Maximum | 37.9% | 56.2% |
| Range | 31.5% | 53.3% |
| Mean | 20.9% | 29.7% |
| Median | 21.2% | 30.2% |
| Interquartile 25% (IQ1) | 13.2% | 22.0% |
| Interquartile 75% (IQ3) | 26.5% | 37.2% |
| Interquartile Range (IQR) | 13.2% | 15.2% |
| Standard Deviation (Sample) | 8.2% | 11.5% |
| Standard Deviation (Population) | 8.0% | 11.4% |
Similar Demographics by Bachelor's Degree
Demographics Similar to Fijians by Bachelor's Degree
In terms of bachelor's degree, the demographic groups most similar to Fijians are Tsimshian (28.8%, a difference of 0.14%), Alaskan Athabascan (28.8%, a difference of 0.36%), Kiowa (28.8%, a difference of 0.44%), Creek (28.9%, a difference of 0.48%), and Dutch West Indian (28.5%, a difference of 0.71%).
| Demographics | Rating | Rank | Bachelor's Degree |
| Sioux | 0.0 /100 | #316 | Tragic 29.1% |
| Colville | 0.0 /100 | #317 | Tragic 29.0% |
| Yaqui | 0.0 /100 | #318 | Tragic 29.0% |
| Creek | 0.0 /100 | #319 | Tragic 28.9% |
| Kiowa | 0.0 /100 | #320 | Tragic 28.8% |
| Alaskan Athabascans | 0.0 /100 | #321 | Tragic 28.8% |
| Tsimshian | 0.0 /100 | #322 | Tragic 28.8% |
| Fijians | 0.0 /100 | #323 | Tragic 28.7% |
| Dutch West Indians | 0.0 /100 | #324 | Tragic 28.5% |
| Pennsylvania Germans | 0.0 /100 | #325 | Tragic 28.4% |
| Apache | 0.0 /100 | #326 | Tragic 28.3% |
| Paiute | 0.0 /100 | #327 | Tragic 28.1% |
| Crow | 0.0 /100 | #328 | Tragic 27.7% |
| Immigrants | Central America | 0.0 /100 | #329 | Tragic 27.5% |
| Spanish American Indians | 0.0 /100 | #330 | Tragic 27.5% |
Demographics Similar to Immigrants from Vietnam by Bachelor's Degree
In terms of bachelor's degree, the demographic groups most similar to Immigrants from Vietnam are Yugoslavian (37.1%, a difference of 0.060%), Nigerian (37.2%, a difference of 0.20%), Swiss (37.2%, a difference of 0.22%), Belgian (37.0%, a difference of 0.25%), and Korean (37.0%, a difference of 0.27%).
| Demographics | Rating | Rank | Bachelor's Degree |
| Immigrants | Peru | 41.3 /100 | #185 | Average 37.5% |
| Norwegians | 40.4 /100 | #186 | Average 37.5% |
| English | 39.7 /100 | #187 | Fair 37.4% |
| Immigrants | Oceania | 37.3 /100 | #188 | Fair 37.3% |
| Slovaks | 36.9 /100 | #189 | Fair 37.3% |
| Swiss | 34.1 /100 | #190 | Fair 37.2% |
| Nigerians | 33.9 /100 | #191 | Fair 37.2% |
| Immigrants | Vietnam | 32.1 /100 | #192 | Fair 37.1% |
| Yugoslavians | 31.5 /100 | #193 | Fair 37.1% |
| Belgians | 29.9 /100 | #194 | Fair 37.0% |
| Koreans | 29.8 /100 | #195 | Fair 37.0% |
| Celtics | 29.5 /100 | #196 | Fair 37.0% |
| Czechoslovakians | 29.2 /100 | #197 | Fair 37.0% |
| Welsh | 29.1 /100 | #198 | Fair 37.0% |
| Immigrants | Costa Rica | 27.4 /100 | #199 | Fair 36.9% |