Immigrants from Chile vs Immigrants from Haiti 6th Grade
COMPARE
Immigrants from Chile
Immigrants from Haiti
6th Grade
6th Grade Comparison
Immigrants from Chile
Immigrants from Haiti
96.8%
6TH GRADE
14.2/ 100
METRIC RATING
202nd/ 347
METRIC RANK
95.6%
6TH GRADE
0.0/ 100
METRIC RATING
306th/ 347
METRIC RANK
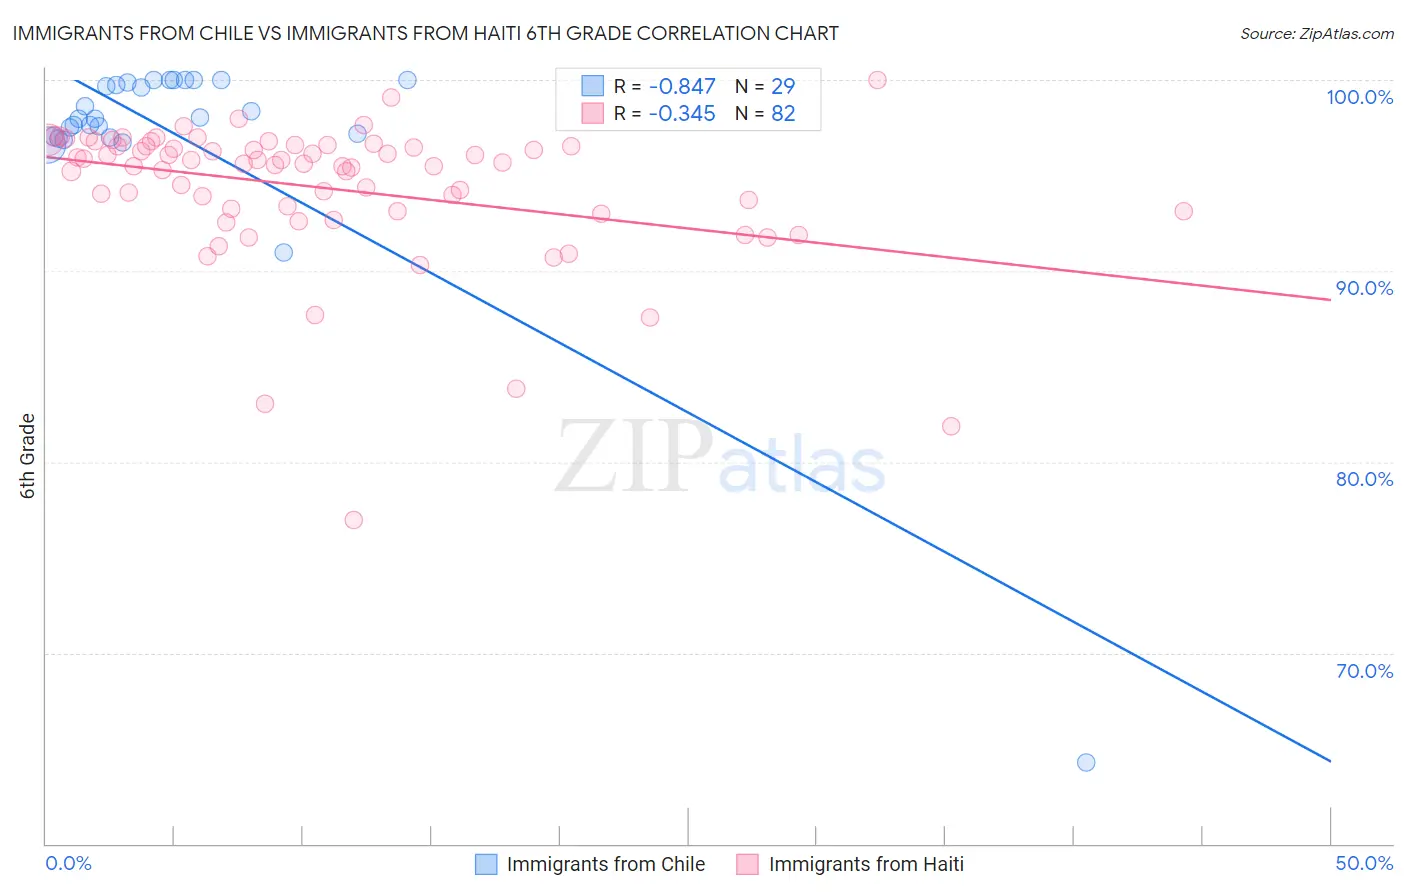
Immigrants from Chile vs Immigrants from Haiti 6th Grade Correlation Chart
The statistical analysis conducted on geographies consisting of 218,647,266 people shows a very strong negative correlation between the proportion of Immigrants from Chile and percentage of population with at least 6th grade education in the United States with a correlation coefficient (R) of -0.847 and weighted average of 96.8%. Similarly, the statistical analysis conducted on geographies consisting of 225,287,083 people shows a mild negative correlation between the proportion of Immigrants from Haiti and percentage of population with at least 6th grade education in the United States with a correlation coefficient (R) of -0.345 and weighted average of 95.6%, a difference of 1.3%.
6th Grade Correlation Summary
| Measurement | Immigrants from Chile | Immigrants from Haiti |
| Minimum | 64.3% | 76.9% |
| Maximum | 100.0% | 100.0% |
| Range | 35.7% | 23.1% |
| Mean | 97.0% | 94.3% |
| Median | 98.0% | 95.6% |
| Interquartile 25% (IQ1) | 97.0% | 93.2% |
| Interquartile 75% (IQ3) | 99.9% | 96.6% |
| Interquartile Range (IQR) | 2.9% | 3.4% |
| Standard Deviation (Sample) | 6.6% | 3.8% |
| Standard Deviation (Population) | 6.5% | 3.8% |
Similar Demographics by 6th Grade
Demographics Similar to Immigrants from Chile by 6th Grade
In terms of 6th grade, the demographic groups most similar to Immigrants from Chile are Immigrants from Zaire (96.9%, a difference of 0.0%), Sudanese (96.8%, a difference of 0.0%), Immigrants from Bahamas (96.8%, a difference of 0.0%), Immigrants from Northern Africa (96.9%, a difference of 0.010%), and African (96.9%, a difference of 0.010%).
| Demographics | Rating | Rank | 6th Grade |
| Immigrants | Brazil | 25.5 /100 | #195 | Fair 96.9% |
| Immigrants | Uganda | 21.2 /100 | #196 | Fair 96.9% |
| Brazilians | 20.1 /100 | #197 | Fair 96.9% |
| Immigrants | Albania | 18.8 /100 | #198 | Poor 96.9% |
| Immigrants | Northern Africa | 15.7 /100 | #199 | Poor 96.9% |
| Africans | 14.8 /100 | #200 | Poor 96.9% |
| Immigrants | Zaire | 14.5 /100 | #201 | Poor 96.9% |
| Immigrants | Chile | 14.2 /100 | #202 | Poor 96.8% |
| Sudanese | 13.9 /100 | #203 | Poor 96.8% |
| Immigrants | Bahamas | 13.8 /100 | #204 | Poor 96.8% |
| Natives/Alaskans | 13.0 /100 | #205 | Poor 96.8% |
| Laotians | 11.8 /100 | #206 | Poor 96.8% |
| Iraqis | 11.7 /100 | #207 | Poor 96.8% |
| Samoans | 11.0 /100 | #208 | Poor 96.8% |
| Immigrants | Oceania | 11.0 /100 | #209 | Poor 96.8% |
Demographics Similar to Immigrants from Haiti by 6th Grade
In terms of 6th grade, the demographic groups most similar to Immigrants from Haiti are Guyanese (95.6%, a difference of 0.020%), Immigrants from Caribbean (95.6%, a difference of 0.030%), Immigrants from Cuba (95.6%, a difference of 0.040%), Indonesian (95.6%, a difference of 0.060%), and Bangladeshi (95.7%, a difference of 0.070%).
| Demographics | Rating | Rank | 6th Grade |
| Immigrants | Laos | 0.0 /100 | #299 | Tragic 95.7% |
| Immigrants | Dominica | 0.0 /100 | #300 | Tragic 95.7% |
| Immigrants | Immigrants | 0.0 /100 | #301 | Tragic 95.7% |
| Immigrants | Burma/Myanmar | 0.0 /100 | #302 | Tragic 95.7% |
| Bangladeshis | 0.0 /100 | #303 | Tragic 95.7% |
| Indonesians | 0.0 /100 | #304 | Tragic 95.6% |
| Immigrants | Cuba | 0.0 /100 | #305 | Tragic 95.6% |
| Immigrants | Haiti | 0.0 /100 | #306 | Tragic 95.6% |
| Guyanese | 0.0 /100 | #307 | Tragic 95.6% |
| Immigrants | Caribbean | 0.0 /100 | #308 | Tragic 95.6% |
| Puerto Ricans | 0.0 /100 | #309 | Tragic 95.5% |
| Ecuadorians | 0.0 /100 | #310 | Tragic 95.5% |
| Immigrants | Portugal | 0.0 /100 | #311 | Tragic 95.5% |
| Immigrants | Guyana | 0.0 /100 | #312 | Tragic 95.5% |
| Nicaraguans | 0.0 /100 | #313 | Tragic 95.4% |