Immigrants from Argentina vs Immigrants from Haiti 6th Grade
COMPARE
Immigrants from Argentina
Immigrants from Haiti
6th Grade
6th Grade Comparison
Immigrants from Argentina
Immigrants from Haiti
97.0%
6TH GRADE
30.4/ 100
METRIC RATING
188th/ 347
METRIC RANK
95.6%
6TH GRADE
0.0/ 100
METRIC RATING
306th/ 347
METRIC RANK
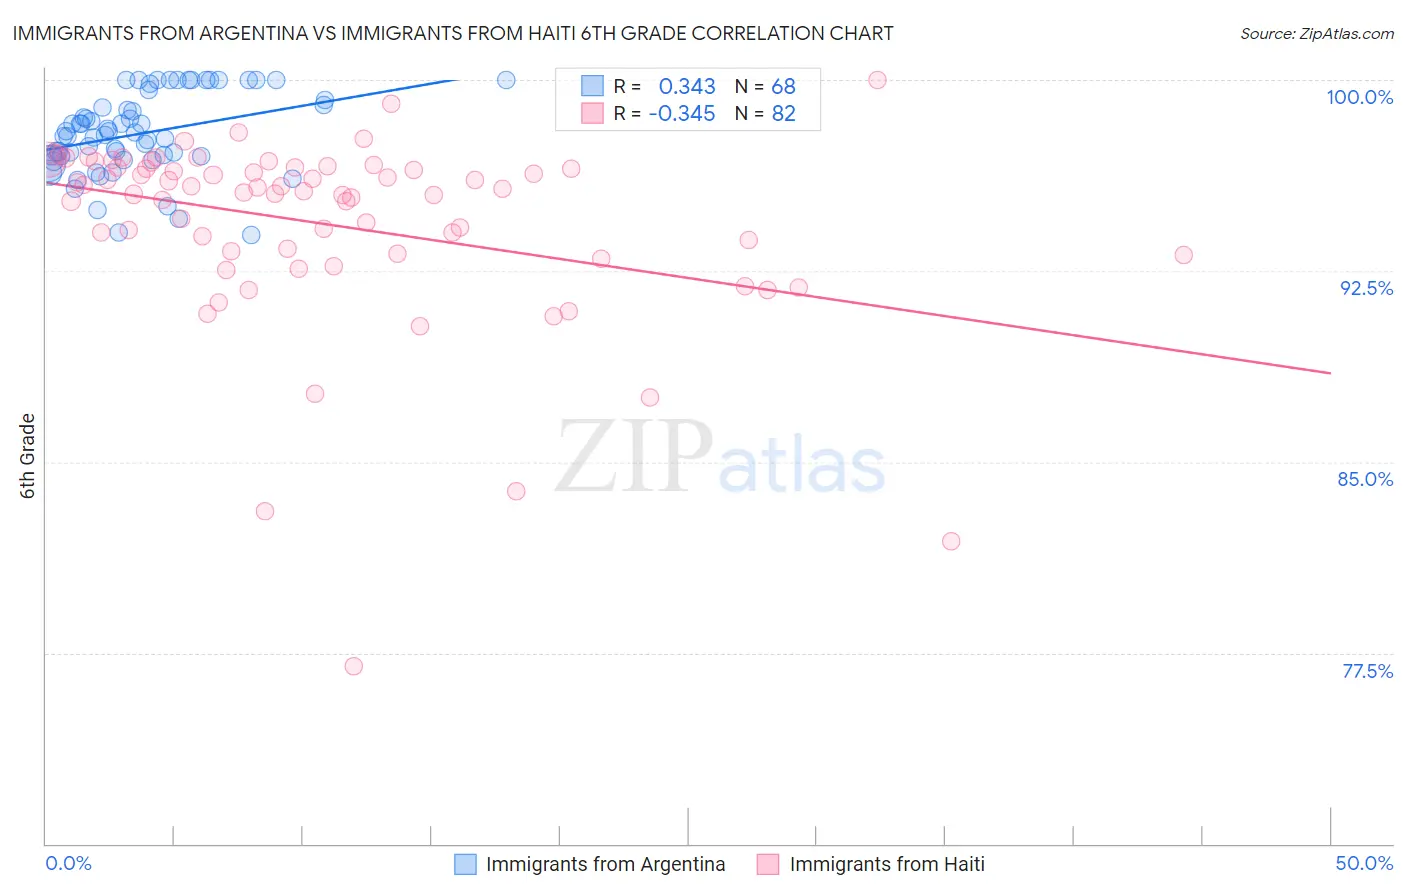
Immigrants from Argentina vs Immigrants from Haiti 6th Grade Correlation Chart
The statistical analysis conducted on geographies consisting of 264,434,317 people shows a mild positive correlation between the proportion of Immigrants from Argentina and percentage of population with at least 6th grade education in the United States with a correlation coefficient (R) of 0.343 and weighted average of 97.0%. Similarly, the statistical analysis conducted on geographies consisting of 225,287,083 people shows a mild negative correlation between the proportion of Immigrants from Haiti and percentage of population with at least 6th grade education in the United States with a correlation coefficient (R) of -0.345 and weighted average of 95.6%, a difference of 1.4%.
6th Grade Correlation Summary
| Measurement | Immigrants from Argentina | Immigrants from Haiti |
| Minimum | 93.9% | 76.9% |
| Maximum | 100.0% | 100.0% |
| Range | 6.1% | 23.1% |
| Mean | 97.9% | 94.3% |
| Median | 97.9% | 95.6% |
| Interquartile 25% (IQ1) | 97.0% | 93.2% |
| Interquartile 75% (IQ3) | 99.1% | 96.6% |
| Interquartile Range (IQR) | 2.1% | 3.4% |
| Standard Deviation (Sample) | 1.6% | 3.8% |
| Standard Deviation (Population) | 1.6% | 3.8% |
Similar Demographics by 6th Grade
Demographics Similar to Immigrants from Argentina by 6th Grade
In terms of 6th grade, the demographic groups most similar to Immigrants from Argentina are Guamanian/Chamorro (97.0%, a difference of 0.0%), Black/African American (97.0%, a difference of 0.0%), Argentinean (97.0%, a difference of 0.010%), Immigrants from Egypt (97.0%, a difference of 0.010%), and Dutch West Indian (96.9%, a difference of 0.010%).
| Demographics | Rating | Rank | 6th Grade |
| Comanche | 37.9 /100 | #181 | Fair 97.0% |
| Immigrants | Ukraine | 35.6 /100 | #182 | Fair 97.0% |
| Immigrants | Venezuela | 34.5 /100 | #183 | Fair 97.0% |
| Spanish Americans | 33.5 /100 | #184 | Fair 97.0% |
| Argentineans | 33.0 /100 | #185 | Fair 97.0% |
| Immigrants | Egypt | 31.4 /100 | #186 | Fair 97.0% |
| Guamanians/Chamorros | 30.6 /100 | #187 | Fair 97.0% |
| Immigrants | Argentina | 30.4 /100 | #188 | Fair 97.0% |
| Blacks/African Americans | 30.2 /100 | #189 | Fair 97.0% |
| Dutch West Indians | 28.3 /100 | #190 | Fair 96.9% |
| Panamanians | 27.3 /100 | #191 | Fair 96.9% |
| Hawaiians | 27.0 /100 | #192 | Fair 96.9% |
| Paraguayans | 26.6 /100 | #193 | Fair 96.9% |
| Immigrants | Lebanon | 25.6 /100 | #194 | Fair 96.9% |
| Immigrants | Brazil | 25.5 /100 | #195 | Fair 96.9% |
Demographics Similar to Immigrants from Haiti by 6th Grade
In terms of 6th grade, the demographic groups most similar to Immigrants from Haiti are Guyanese (95.6%, a difference of 0.020%), Immigrants from Caribbean (95.6%, a difference of 0.030%), Immigrants from Cuba (95.6%, a difference of 0.040%), Indonesian (95.6%, a difference of 0.060%), and Bangladeshi (95.7%, a difference of 0.070%).
| Demographics | Rating | Rank | 6th Grade |
| Immigrants | Laos | 0.0 /100 | #299 | Tragic 95.7% |
| Immigrants | Dominica | 0.0 /100 | #300 | Tragic 95.7% |
| Immigrants | Immigrants | 0.0 /100 | #301 | Tragic 95.7% |
| Immigrants | Burma/Myanmar | 0.0 /100 | #302 | Tragic 95.7% |
| Bangladeshis | 0.0 /100 | #303 | Tragic 95.7% |
| Indonesians | 0.0 /100 | #304 | Tragic 95.6% |
| Immigrants | Cuba | 0.0 /100 | #305 | Tragic 95.6% |
| Immigrants | Haiti | 0.0 /100 | #306 | Tragic 95.6% |
| Guyanese | 0.0 /100 | #307 | Tragic 95.6% |
| Immigrants | Caribbean | 0.0 /100 | #308 | Tragic 95.6% |
| Puerto Ricans | 0.0 /100 | #309 | Tragic 95.5% |
| Ecuadorians | 0.0 /100 | #310 | Tragic 95.5% |
| Immigrants | Portugal | 0.0 /100 | #311 | Tragic 95.5% |
| Immigrants | Guyana | 0.0 /100 | #312 | Tragic 95.5% |
| Nicaraguans | 0.0 /100 | #313 | Tragic 95.4% |