Immigrants from Chile vs British 6th Grade
COMPARE
Immigrants from Chile
British
6th Grade
6th Grade Comparison
Immigrants from Chile
British
96.8%
6TH GRADE
14.2/ 100
METRIC RATING
202nd/ 347
METRIC RANK
97.9%
6TH GRADE
100.0/ 100
METRIC RATING
37th/ 347
METRIC RANK
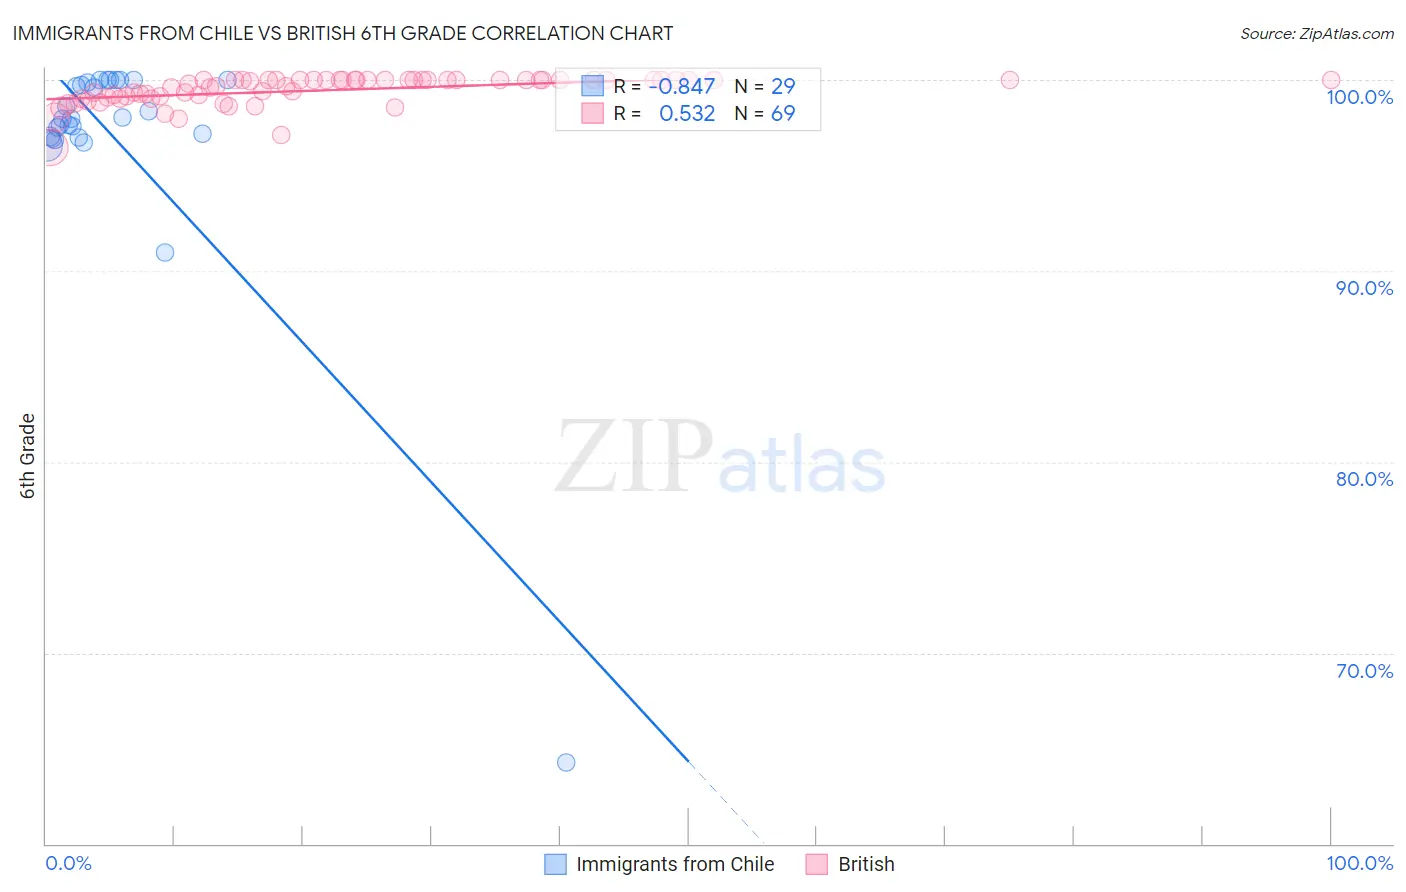
Immigrants from Chile vs British 6th Grade Correlation Chart
The statistical analysis conducted on geographies consisting of 218,647,266 people shows a very strong negative correlation between the proportion of Immigrants from Chile and percentage of population with at least 6th grade education in the United States with a correlation coefficient (R) of -0.847 and weighted average of 96.8%. Similarly, the statistical analysis conducted on geographies consisting of 531,462,526 people shows a substantial positive correlation between the proportion of British and percentage of population with at least 6th grade education in the United States with a correlation coefficient (R) of 0.532 and weighted average of 97.9%, a difference of 1.1%.
6th Grade Correlation Summary
| Measurement | Immigrants from Chile | British |
| Minimum | 64.3% | 96.5% |
| Maximum | 100.0% | 100.0% |
| Range | 35.7% | 3.5% |
| Mean | 97.0% | 99.5% |
| Median | 98.0% | 99.9% |
| Interquartile 25% (IQ1) | 97.0% | 99.1% |
| Interquartile 75% (IQ3) | 99.9% | 100.0% |
| Interquartile Range (IQR) | 2.9% | 0.94% |
| Standard Deviation (Sample) | 6.6% | 0.74% |
| Standard Deviation (Population) | 6.5% | 0.73% |
Similar Demographics by 6th Grade
Demographics Similar to Immigrants from Chile by 6th Grade
In terms of 6th grade, the demographic groups most similar to Immigrants from Chile are Immigrants from Zaire (96.9%, a difference of 0.0%), Sudanese (96.8%, a difference of 0.0%), Immigrants from Bahamas (96.8%, a difference of 0.0%), Immigrants from Northern Africa (96.9%, a difference of 0.010%), and African (96.9%, a difference of 0.010%).
| Demographics | Rating | Rank | 6th Grade |
| Immigrants | Brazil | 25.5 /100 | #195 | Fair 96.9% |
| Immigrants | Uganda | 21.2 /100 | #196 | Fair 96.9% |
| Brazilians | 20.1 /100 | #197 | Fair 96.9% |
| Immigrants | Albania | 18.8 /100 | #198 | Poor 96.9% |
| Immigrants | Northern Africa | 15.7 /100 | #199 | Poor 96.9% |
| Africans | 14.8 /100 | #200 | Poor 96.9% |
| Immigrants | Zaire | 14.5 /100 | #201 | Poor 96.9% |
| Immigrants | Chile | 14.2 /100 | #202 | Poor 96.8% |
| Sudanese | 13.9 /100 | #203 | Poor 96.8% |
| Immigrants | Bahamas | 13.8 /100 | #204 | Poor 96.8% |
| Natives/Alaskans | 13.0 /100 | #205 | Poor 96.8% |
| Laotians | 11.8 /100 | #206 | Poor 96.8% |
| Iraqis | 11.7 /100 | #207 | Poor 96.8% |
| Samoans | 11.0 /100 | #208 | Poor 96.8% |
| Immigrants | Oceania | 11.0 /100 | #209 | Poor 96.8% |
Demographics Similar to British by 6th Grade
In terms of 6th grade, the demographic groups most similar to British are Chinese (97.9%, a difference of 0.010%), Italian (97.9%, a difference of 0.010%), Belgian (97.9%, a difference of 0.020%), Luxembourger (97.9%, a difference of 0.020%), and Swiss (97.9%, a difference of 0.030%).
| Demographics | Rating | Rank | 6th Grade |
| French Canadians | 100.0 /100 | #30 | Exceptional 98.0% |
| Europeans | 100.0 /100 | #31 | Exceptional 98.0% |
| Alaska Natives | 100.0 /100 | #32 | Exceptional 98.0% |
| Chippewa | 100.0 /100 | #33 | Exceptional 97.9% |
| Swiss | 100.0 /100 | #34 | Exceptional 97.9% |
| Chinese | 100.0 /100 | #35 | Exceptional 97.9% |
| Italians | 100.0 /100 | #36 | Exceptional 97.9% |
| British | 100.0 /100 | #37 | Exceptional 97.9% |
| Belgians | 100.0 /100 | #38 | Exceptional 97.9% |
| Luxembourgers | 99.9 /100 | #39 | Exceptional 97.9% |
| Latvians | 99.9 /100 | #40 | Exceptional 97.9% |
| Eastern Europeans | 99.9 /100 | #41 | Exceptional 97.9% |
| Hungarians | 99.9 /100 | #42 | Exceptional 97.8% |
| Northern Europeans | 99.9 /100 | #43 | Exceptional 97.8% |
| Czechoslovakians | 99.9 /100 | #44 | Exceptional 97.8% |