Honduran vs Immigrants from Haiti 6th Grade
COMPARE
Honduran
Immigrants from Haiti
6th Grade
6th Grade Comparison
Hondurans
Immigrants from Haiti
95.0%
6TH GRADE
0.0/ 100
METRIC RATING
328th/ 347
METRIC RANK
95.6%
6TH GRADE
0.0/ 100
METRIC RATING
306th/ 347
METRIC RANK
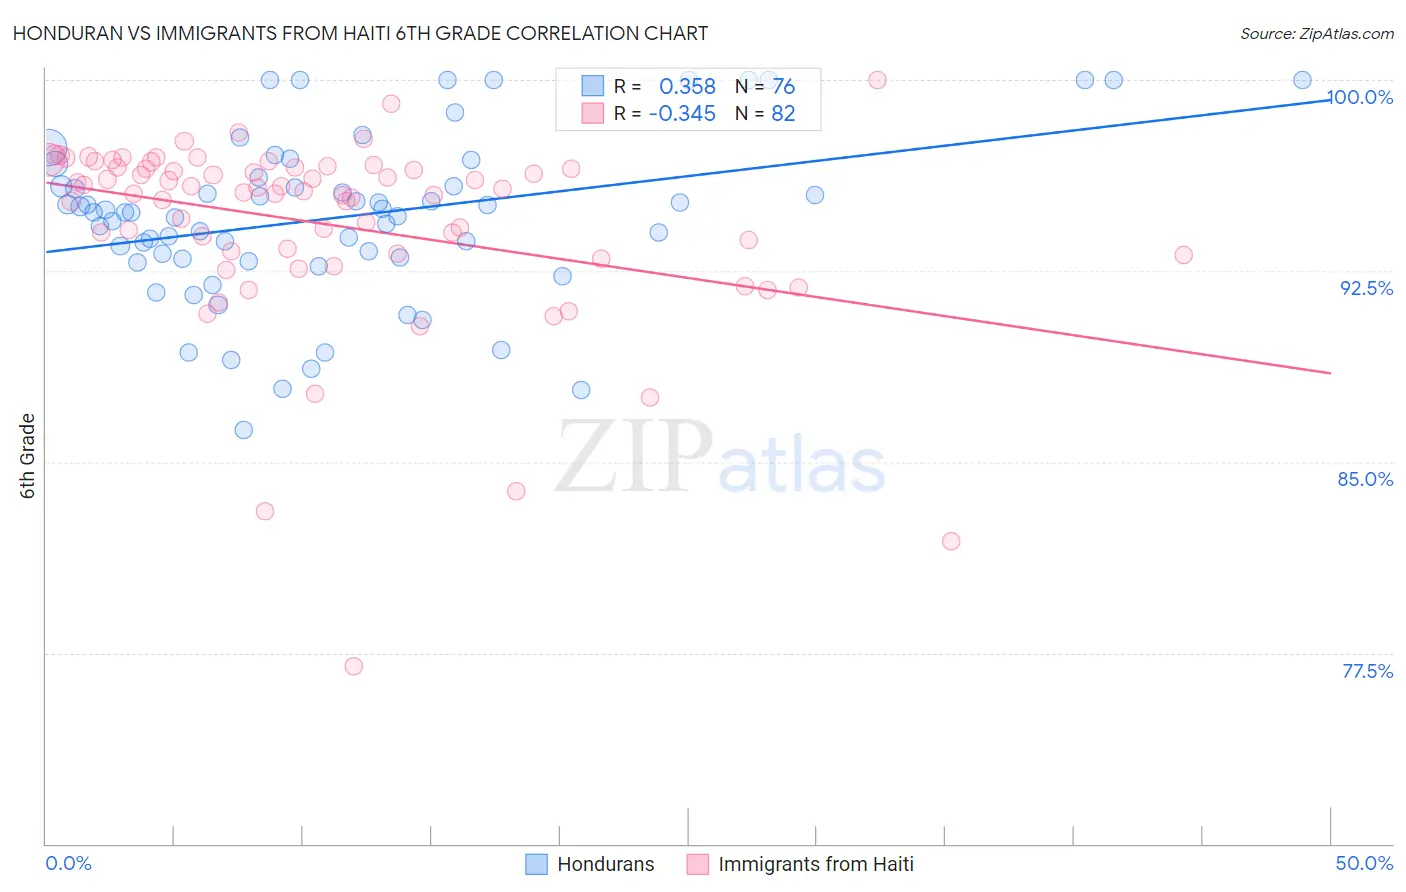
Honduran vs Immigrants from Haiti 6th Grade Correlation Chart
The statistical analysis conducted on geographies consisting of 357,784,803 people shows a mild positive correlation between the proportion of Hondurans and percentage of population with at least 6th grade education in the United States with a correlation coefficient (R) of 0.358 and weighted average of 95.0%. Similarly, the statistical analysis conducted on geographies consisting of 225,287,083 people shows a mild negative correlation between the proportion of Immigrants from Haiti and percentage of population with at least 6th grade education in the United States with a correlation coefficient (R) of -0.345 and weighted average of 95.6%, a difference of 0.62%.
6th Grade Correlation Summary
| Measurement | Honduran | Immigrants from Haiti |
| Minimum | 86.2% | 76.9% |
| Maximum | 100.0% | 100.0% |
| Range | 13.8% | 23.1% |
| Mean | 94.6% | 94.3% |
| Median | 94.8% | 95.6% |
| Interquartile 25% (IQ1) | 93.0% | 93.2% |
| Interquartile 75% (IQ3) | 96.0% | 96.6% |
| Interquartile Range (IQR) | 3.0% | 3.4% |
| Standard Deviation (Sample) | 3.2% | 3.8% |
| Standard Deviation (Population) | 3.2% | 3.8% |
Similar Demographics by 6th Grade
Demographics Similar to Hondurans by 6th Grade
In terms of 6th grade, the demographic groups most similar to Hondurans are Mexican American Indian (95.0%, a difference of 0.010%), Hispanic or Latino (95.0%, a difference of 0.030%), Dominican (94.9%, a difference of 0.060%), Immigrants from Nicaragua (95.1%, a difference of 0.10%), and Cape Verdean (95.1%, a difference of 0.13%).
| Demographics | Rating | Rank | 6th Grade |
| Immigrants | Fiji | 0.0 /100 | #321 | Tragic 95.2% |
| Immigrants | Cambodia | 0.0 /100 | #322 | Tragic 95.2% |
| Central American Indians | 0.0 /100 | #323 | Tragic 95.1% |
| Cape Verdeans | 0.0 /100 | #324 | Tragic 95.1% |
| Immigrants | Nicaragua | 0.0 /100 | #325 | Tragic 95.1% |
| Hispanics or Latinos | 0.0 /100 | #326 | Tragic 95.0% |
| Mexican American Indians | 0.0 /100 | #327 | Tragic 95.0% |
| Hondurans | 0.0 /100 | #328 | Tragic 95.0% |
| Dominicans | 0.0 /100 | #329 | Tragic 94.9% |
| Nepalese | 0.0 /100 | #330 | Tragic 94.9% |
| Immigrants | Armenia | 0.0 /100 | #331 | Tragic 94.9% |
| Immigrants | Honduras | 0.0 /100 | #332 | Tragic 94.8% |
| Immigrants | Latin America | 0.0 /100 | #333 | Tragic 94.7% |
| Immigrants | Azores | 0.0 /100 | #334 | Tragic 94.7% |
| Mexicans | 0.0 /100 | #335 | Tragic 94.6% |
Demographics Similar to Immigrants from Haiti by 6th Grade
In terms of 6th grade, the demographic groups most similar to Immigrants from Haiti are Guyanese (95.6%, a difference of 0.020%), Immigrants from Caribbean (95.6%, a difference of 0.030%), Immigrants from Cuba (95.6%, a difference of 0.040%), Indonesian (95.6%, a difference of 0.060%), and Bangladeshi (95.7%, a difference of 0.070%).
| Demographics | Rating | Rank | 6th Grade |
| Immigrants | Laos | 0.0 /100 | #299 | Tragic 95.7% |
| Immigrants | Dominica | 0.0 /100 | #300 | Tragic 95.7% |
| Immigrants | Immigrants | 0.0 /100 | #301 | Tragic 95.7% |
| Immigrants | Burma/Myanmar | 0.0 /100 | #302 | Tragic 95.7% |
| Bangladeshis | 0.0 /100 | #303 | Tragic 95.7% |
| Indonesians | 0.0 /100 | #304 | Tragic 95.6% |
| Immigrants | Cuba | 0.0 /100 | #305 | Tragic 95.6% |
| Immigrants | Haiti | 0.0 /100 | #306 | Tragic 95.6% |
| Guyanese | 0.0 /100 | #307 | Tragic 95.6% |
| Immigrants | Caribbean | 0.0 /100 | #308 | Tragic 95.6% |
| Puerto Ricans | 0.0 /100 | #309 | Tragic 95.5% |
| Ecuadorians | 0.0 /100 | #310 | Tragic 95.5% |
| Immigrants | Portugal | 0.0 /100 | #311 | Tragic 95.5% |
| Immigrants | Guyana | 0.0 /100 | #312 | Tragic 95.5% |
| Nicaraguans | 0.0 /100 | #313 | Tragic 95.4% |