Immigrants from Chile vs Serbian 6th Grade
COMPARE
Immigrants from Chile
Serbian
6th Grade
6th Grade Comparison
Immigrants from Chile
Serbians
96.8%
6TH GRADE
14.2/ 100
METRIC RATING
202nd/ 347
METRIC RANK
97.7%
6TH GRADE
99.7/ 100
METRIC RATING
61st/ 347
METRIC RANK
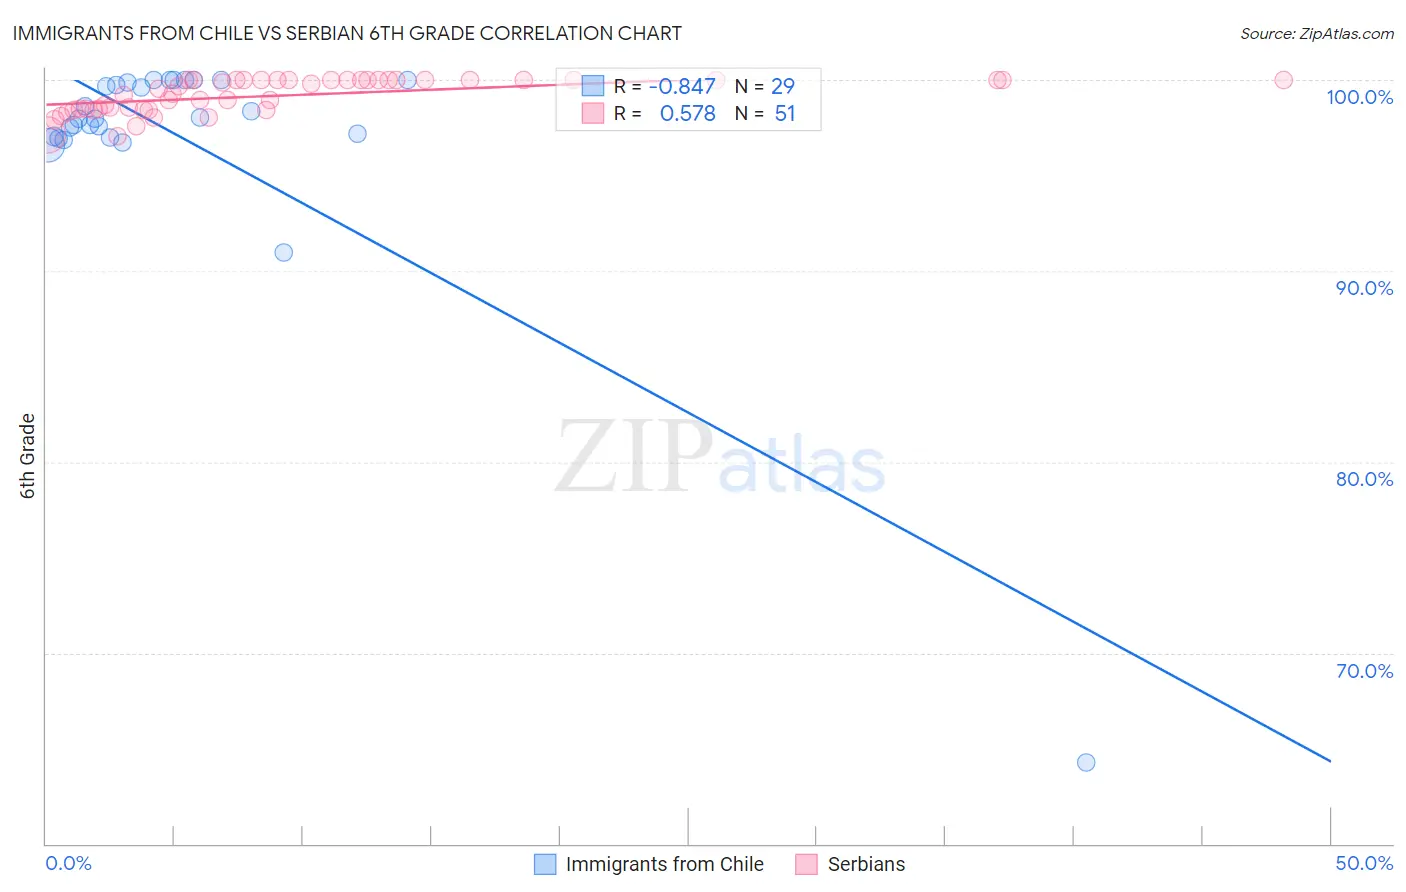
Immigrants from Chile vs Serbian 6th Grade Correlation Chart
The statistical analysis conducted on geographies consisting of 218,647,266 people shows a very strong negative correlation between the proportion of Immigrants from Chile and percentage of population with at least 6th grade education in the United States with a correlation coefficient (R) of -0.847 and weighted average of 96.8%. Similarly, the statistical analysis conducted on geographies consisting of 267,642,942 people shows a substantial positive correlation between the proportion of Serbians and percentage of population with at least 6th grade education in the United States with a correlation coefficient (R) of 0.578 and weighted average of 97.7%, a difference of 0.89%.
6th Grade Correlation Summary
| Measurement | Immigrants from Chile | Serbian |
| Minimum | 64.3% | 97.0% |
| Maximum | 100.0% | 100.0% |
| Range | 35.7% | 3.0% |
| Mean | 97.0% | 99.2% |
| Median | 98.0% | 99.5% |
| Interquartile 25% (IQ1) | 97.0% | 98.4% |
| Interquartile 75% (IQ3) | 99.9% | 100.0% |
| Interquartile Range (IQR) | 2.9% | 1.6% |
| Standard Deviation (Sample) | 6.6% | 0.88% |
| Standard Deviation (Population) | 6.5% | 0.87% |
Similar Demographics by 6th Grade
Demographics Similar to Immigrants from Chile by 6th Grade
In terms of 6th grade, the demographic groups most similar to Immigrants from Chile are Immigrants from Zaire (96.9%, a difference of 0.0%), Sudanese (96.8%, a difference of 0.0%), Immigrants from Bahamas (96.8%, a difference of 0.0%), Immigrants from Northern Africa (96.9%, a difference of 0.010%), and African (96.9%, a difference of 0.010%).
| Demographics | Rating | Rank | 6th Grade |
| Immigrants | Brazil | 25.5 /100 | #195 | Fair 96.9% |
| Immigrants | Uganda | 21.2 /100 | #196 | Fair 96.9% |
| Brazilians | 20.1 /100 | #197 | Fair 96.9% |
| Immigrants | Albania | 18.8 /100 | #198 | Poor 96.9% |
| Immigrants | Northern Africa | 15.7 /100 | #199 | Poor 96.9% |
| Africans | 14.8 /100 | #200 | Poor 96.9% |
| Immigrants | Zaire | 14.5 /100 | #201 | Poor 96.9% |
| Immigrants | Chile | 14.2 /100 | #202 | Poor 96.8% |
| Sudanese | 13.9 /100 | #203 | Poor 96.8% |
| Immigrants | Bahamas | 13.8 /100 | #204 | Poor 96.8% |
| Natives/Alaskans | 13.0 /100 | #205 | Poor 96.8% |
| Laotians | 11.8 /100 | #206 | Poor 96.8% |
| Iraqis | 11.7 /100 | #207 | Poor 96.8% |
| Samoans | 11.0 /100 | #208 | Poor 96.8% |
| Immigrants | Oceania | 11.0 /100 | #209 | Poor 96.8% |
Demographics Similar to Serbians by 6th Grade
In terms of 6th grade, the demographic groups most similar to Serbians are Immigrants from Canada (97.7%, a difference of 0.0%), American (97.7%, a difference of 0.010%), Immigrants from North America (97.7%, a difference of 0.010%), White/Caucasian (97.7%, a difference of 0.020%), and Greek (97.7%, a difference of 0.020%).
| Demographics | Rating | Rank | 6th Grade |
| Creek | 99.8 /100 | #54 | Exceptional 97.7% |
| Aleuts | 99.8 /100 | #55 | Exceptional 97.7% |
| Austrians | 99.8 /100 | #56 | Exceptional 97.7% |
| Whites/Caucasians | 99.8 /100 | #57 | Exceptional 97.7% |
| Greeks | 99.8 /100 | #58 | Exceptional 97.7% |
| Americans | 99.8 /100 | #59 | Exceptional 97.7% |
| Immigrants | Canada | 99.8 /100 | #60 | Exceptional 97.7% |
| Serbians | 99.7 /100 | #61 | Exceptional 97.7% |
| Immigrants | North America | 99.7 /100 | #62 | Exceptional 97.7% |
| Russians | 99.7 /100 | #63 | Exceptional 97.7% |
| Canadians | 99.7 /100 | #64 | Exceptional 97.7% |
| Immigrants | Northern Europe | 99.6 /100 | #65 | Exceptional 97.7% |
| New Zealanders | 99.6 /100 | #66 | Exceptional 97.7% |
| Kiowa | 99.6 /100 | #67 | Exceptional 97.7% |
| Immigrants | Austria | 99.6 /100 | #68 | Exceptional 97.7% |