Immigrants from Central America vs Immigrants from Eastern Asia Associate's Degree
COMPARE
Immigrants from Central America
Immigrants from Eastern Asia
Associate's Degree
Associate's Degree Comparison
Immigrants from Central America
Immigrants from Eastern Asia
35.0%
ASSOCIATE'S DEGREE
0.0/ 100
METRIC RATING
332nd/ 347
METRIC RANK
55.4%
ASSOCIATE'S DEGREE
100.0/ 100
METRIC RATING
15th/ 347
METRIC RANK
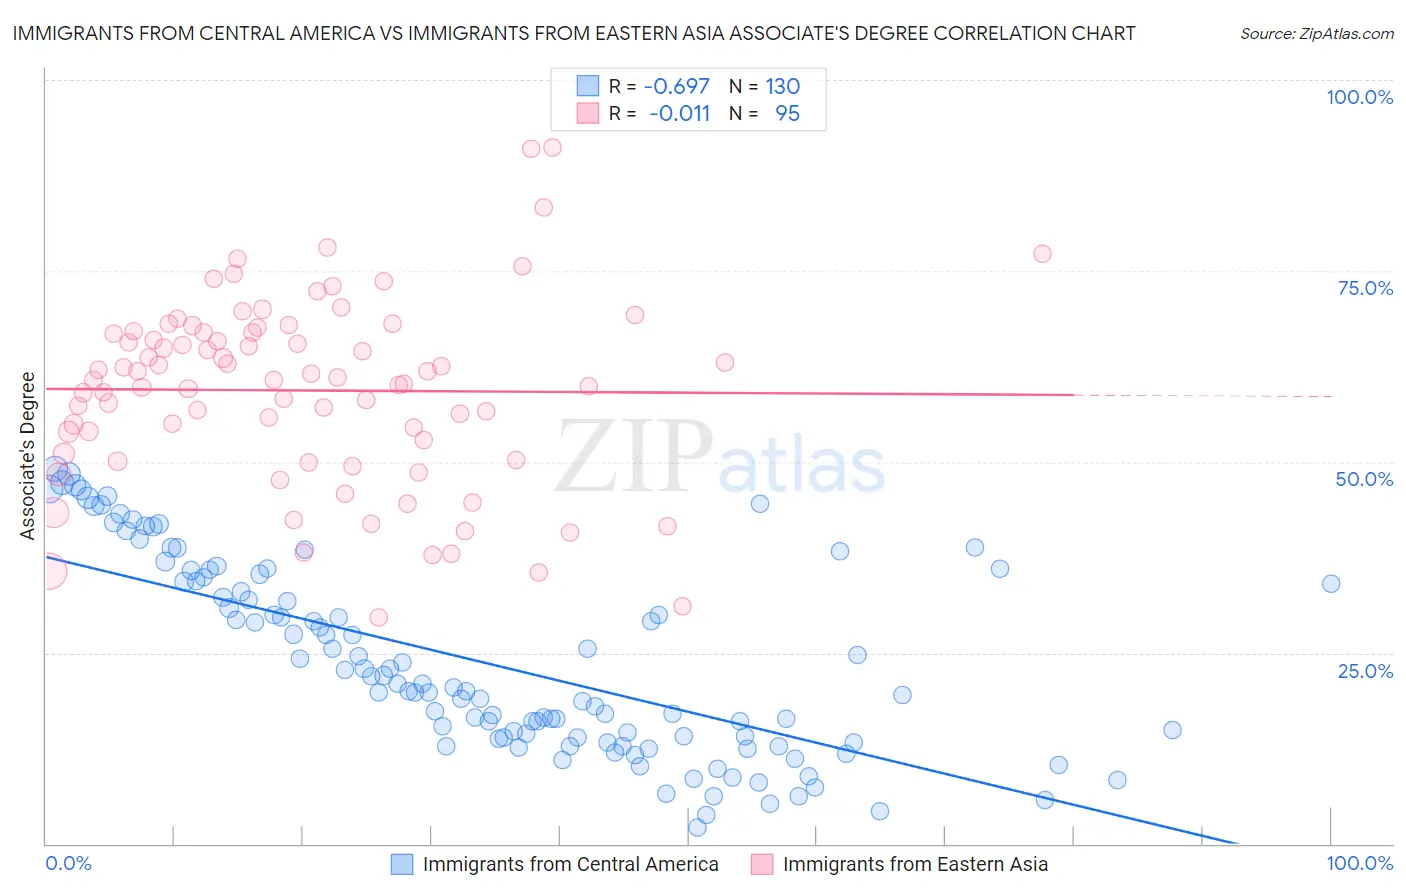
Immigrants from Central America vs Immigrants from Eastern Asia Associate's Degree Correlation Chart
The statistical analysis conducted on geographies consisting of 536,468,789 people shows a significant negative correlation between the proportion of Immigrants from Central America and percentage of population with at least associate's degree education in the United States with a correlation coefficient (R) of -0.697 and weighted average of 35.0%. Similarly, the statistical analysis conducted on geographies consisting of 499,873,400 people shows no correlation between the proportion of Immigrants from Eastern Asia and percentage of population with at least associate's degree education in the United States with a correlation coefficient (R) of -0.011 and weighted average of 55.4%, a difference of 58.1%.
Associate's Degree Correlation Summary
| Measurement | Immigrants from Central America | Immigrants from Eastern Asia |
| Minimum | 2.2% | 29.6% |
| Maximum | 49.1% | 91.1% |
| Range | 46.9% | 61.5% |
| Mean | 23.8% | 59.3% |
| Median | 20.7% | 60.8% |
| Interquartile 25% (IQ1) | 13.9% | 51.1% |
| Interquartile 75% (IQ3) | 34.4% | 66.9% |
| Interquartile Range (IQR) | 20.5% | 15.8% |
| Standard Deviation (Sample) | 12.4% | 12.2% |
| Standard Deviation (Population) | 12.4% | 12.2% |
Similar Demographics by Associate's Degree
Demographics Similar to Immigrants from Central America by Associate's Degree
In terms of associate's degree, the demographic groups most similar to Immigrants from Central America are Mexican (35.0%, a difference of 0.080%), Native/Alaskan (34.9%, a difference of 0.31%), Spanish American Indian (34.9%, a difference of 0.45%), Hopi (34.6%, a difference of 1.3%), and Immigrants from the Azores (35.6%, a difference of 1.8%).
| Demographics | Rating | Rank | Associate's Degree |
| Menominee | 0.0 /100 | #325 | Tragic 36.7% |
| Kiowa | 0.0 /100 | #326 | Tragic 36.5% |
| Dutch West Indians | 0.0 /100 | #327 | Tragic 36.5% |
| Alaskan Athabascans | 0.0 /100 | #328 | Tragic 36.5% |
| Paiute | 0.0 /100 | #329 | Tragic 36.4% |
| Apache | 0.0 /100 | #330 | Tragic 36.2% |
| Immigrants | Azores | 0.0 /100 | #331 | Tragic 35.6% |
| Immigrants | Central America | 0.0 /100 | #332 | Tragic 35.0% |
| Mexicans | 0.0 /100 | #333 | Tragic 35.0% |
| Natives/Alaskans | 0.0 /100 | #334 | Tragic 34.9% |
| Spanish American Indians | 0.0 /100 | #335 | Tragic 34.9% |
| Hopi | 0.0 /100 | #336 | Tragic 34.6% |
| Lumbee | 0.0 /100 | #337 | Tragic 34.1% |
| Pueblo | 0.0 /100 | #338 | Tragic 34.0% |
| Immigrants | Mexico | 0.0 /100 | #339 | Tragic 33.7% |
Demographics Similar to Immigrants from Eastern Asia by Associate's Degree
In terms of associate's degree, the demographic groups most similar to Immigrants from Eastern Asia are Immigrants from Hong Kong (55.4%, a difference of 0.030%), Immigrants from China (55.5%, a difference of 0.17%), Soviet Union (55.1%, a difference of 0.47%), Eastern European (55.0%, a difference of 0.61%), and Immigrants from South Central Asia (55.7%, a difference of 0.67%).
| Demographics | Rating | Rank | Associate's Degree |
| Thais | 100.0 /100 | #8 | Exceptional 57.4% |
| Immigrants | Israel | 100.0 /100 | #9 | Exceptional 56.8% |
| Cypriots | 100.0 /100 | #10 | Exceptional 56.4% |
| Immigrants | Australia | 100.0 /100 | #11 | Exceptional 55.8% |
| Immigrants | South Central Asia | 100.0 /100 | #12 | Exceptional 55.7% |
| Immigrants | China | 100.0 /100 | #13 | Exceptional 55.5% |
| Immigrants | Hong Kong | 100.0 /100 | #14 | Exceptional 55.4% |
| Immigrants | Eastern Asia | 100.0 /100 | #15 | Exceptional 55.4% |
| Soviet Union | 100.0 /100 | #16 | Exceptional 55.1% |
| Eastern Europeans | 100.0 /100 | #17 | Exceptional 55.0% |
| Indians (Asian) | 100.0 /100 | #18 | Exceptional 54.8% |
| Immigrants | Ireland | 100.0 /100 | #19 | Exceptional 54.7% |
| Cambodians | 100.0 /100 | #20 | Exceptional 54.6% |
| Immigrants | Sweden | 100.0 /100 | #21 | Exceptional 54.6% |
| Immigrants | Japan | 100.0 /100 | #22 | Exceptional 54.6% |