Immigrants from Central America vs Turkish Bachelor's Degree
COMPARE
Immigrants from Central America
Turkish
Bachelor's Degree
Bachelor's Degree Comparison
Immigrants from Central America
Turks
27.5%
BACHELOR'S DEGREE
0.0/ 100
METRIC RATING
329th/ 347
METRIC RANK
46.2%
BACHELOR'S DEGREE
100.0/ 100
METRIC RATING
28th/ 347
METRIC RANK
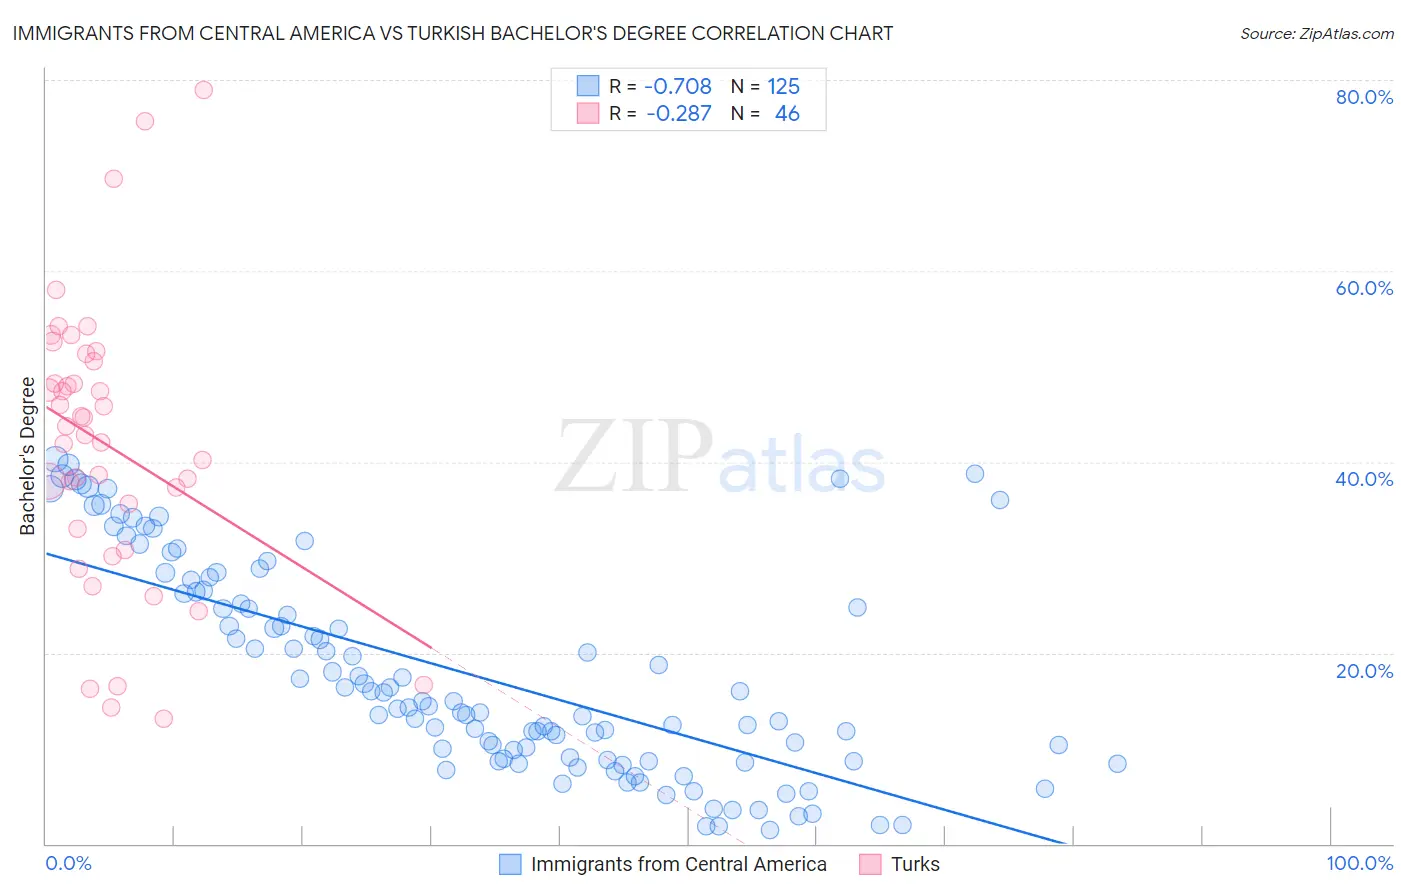
Immigrants from Central America vs Turkish Bachelor's Degree Correlation Chart
The statistical analysis conducted on geographies consisting of 536,401,370 people shows a strong negative correlation between the proportion of Immigrants from Central America and percentage of population with at least bachelor's degree education in the United States with a correlation coefficient (R) of -0.708 and weighted average of 27.5%. Similarly, the statistical analysis conducted on geographies consisting of 271,847,696 people shows a weak negative correlation between the proportion of Turks and percentage of population with at least bachelor's degree education in the United States with a correlation coefficient (R) of -0.287 and weighted average of 46.2%, a difference of 68.1%.
Bachelor's Degree Correlation Summary
| Measurement | Immigrants from Central America | Turkish |
| Minimum | 1.4% | 13.1% |
| Maximum | 40.3% | 78.9% |
| Range | 38.8% | 65.8% |
| Mean | 17.9% | 41.8% |
| Median | 14.9% | 43.3% |
| Interquartile 25% (IQ1) | 8.9% | 33.0% |
| Interquartile 75% (IQ3) | 26.5% | 50.5% |
| Interquartile Range (IQR) | 17.6% | 17.5% |
| Standard Deviation (Sample) | 10.9% | 14.7% |
| Standard Deviation (Population) | 10.9% | 14.5% |
Similar Demographics by Bachelor's Degree
Demographics Similar to Immigrants from Central America by Bachelor's Degree
In terms of bachelor's degree, the demographic groups most similar to Immigrants from Central America are Spanish American Indian (27.5%, a difference of 0.060%), Immigrants from the Azores (27.3%, a difference of 0.54%), Menominee (27.3%, a difference of 0.64%), Crow (27.7%, a difference of 1.0%), and Mexican (27.1%, a difference of 1.5%).
| Demographics | Rating | Rank | Bachelor's Degree |
| Tsimshian | 0.0 /100 | #322 | Tragic 28.8% |
| Fijians | 0.0 /100 | #323 | Tragic 28.7% |
| Dutch West Indians | 0.0 /100 | #324 | Tragic 28.5% |
| Pennsylvania Germans | 0.0 /100 | #325 | Tragic 28.4% |
| Apache | 0.0 /100 | #326 | Tragic 28.3% |
| Paiute | 0.0 /100 | #327 | Tragic 28.1% |
| Crow | 0.0 /100 | #328 | Tragic 27.7% |
| Immigrants | Central America | 0.0 /100 | #329 | Tragic 27.5% |
| Spanish American Indians | 0.0 /100 | #330 | Tragic 27.5% |
| Immigrants | Azores | 0.0 /100 | #331 | Tragic 27.3% |
| Menominee | 0.0 /100 | #332 | Tragic 27.3% |
| Mexicans | 0.0 /100 | #333 | Tragic 27.1% |
| Arapaho | 0.0 /100 | #334 | Tragic 26.6% |
| Natives/Alaskans | 0.0 /100 | #335 | Tragic 26.3% |
| Immigrants | Mexico | 0.0 /100 | #336 | Tragic 26.1% |
Demographics Similar to Turks by Bachelor's Degree
In terms of bachelor's degree, the demographic groups most similar to Turks are Israeli (46.1%, a difference of 0.13%), Immigrants from Sri Lanka (46.1%, a difference of 0.18%), Latvian (46.1%, a difference of 0.22%), Immigrants from France (46.4%, a difference of 0.46%), and Immigrants from Turkey (46.0%, a difference of 0.52%).
| Demographics | Rating | Rank | Bachelor's Degree |
| Immigrants | Ireland | 100.0 /100 | #21 | Exceptional 47.1% |
| Immigrants | Belgium | 100.0 /100 | #22 | Exceptional 47.0% |
| Immigrants | Sweden | 100.0 /100 | #23 | Exceptional 47.0% |
| Immigrants | Korea | 100.0 /100 | #24 | Exceptional 47.0% |
| Burmese | 100.0 /100 | #25 | Exceptional 46.9% |
| Immigrants | Japan | 100.0 /100 | #26 | Exceptional 46.8% |
| Immigrants | France | 100.0 /100 | #27 | Exceptional 46.4% |
| Turks | 100.0 /100 | #28 | Exceptional 46.2% |
| Israelis | 100.0 /100 | #29 | Exceptional 46.1% |
| Immigrants | Sri Lanka | 100.0 /100 | #30 | Exceptional 46.1% |
| Latvians | 100.0 /100 | #31 | Exceptional 46.1% |
| Immigrants | Turkey | 100.0 /100 | #32 | Exceptional 46.0% |
| Immigrants | Northern Europe | 100.0 /100 | #33 | Exceptional 45.6% |
| Immigrants | Denmark | 100.0 /100 | #34 | Exceptional 45.4% |
| Immigrants | Russia | 100.0 /100 | #35 | Exceptional 45.4% |