Immigrants from Central America vs Irish Bachelor's Degree
COMPARE
Immigrants from Central America
Irish
Bachelor's Degree
Bachelor's Degree Comparison
Immigrants from Central America
Irish
27.5%
BACHELOR'S DEGREE
0.0/ 100
METRIC RATING
329th/ 347
METRIC RANK
37.6%
BACHELOR'S DEGREE
44.3/ 100
METRIC RATING
180th/ 347
METRIC RANK
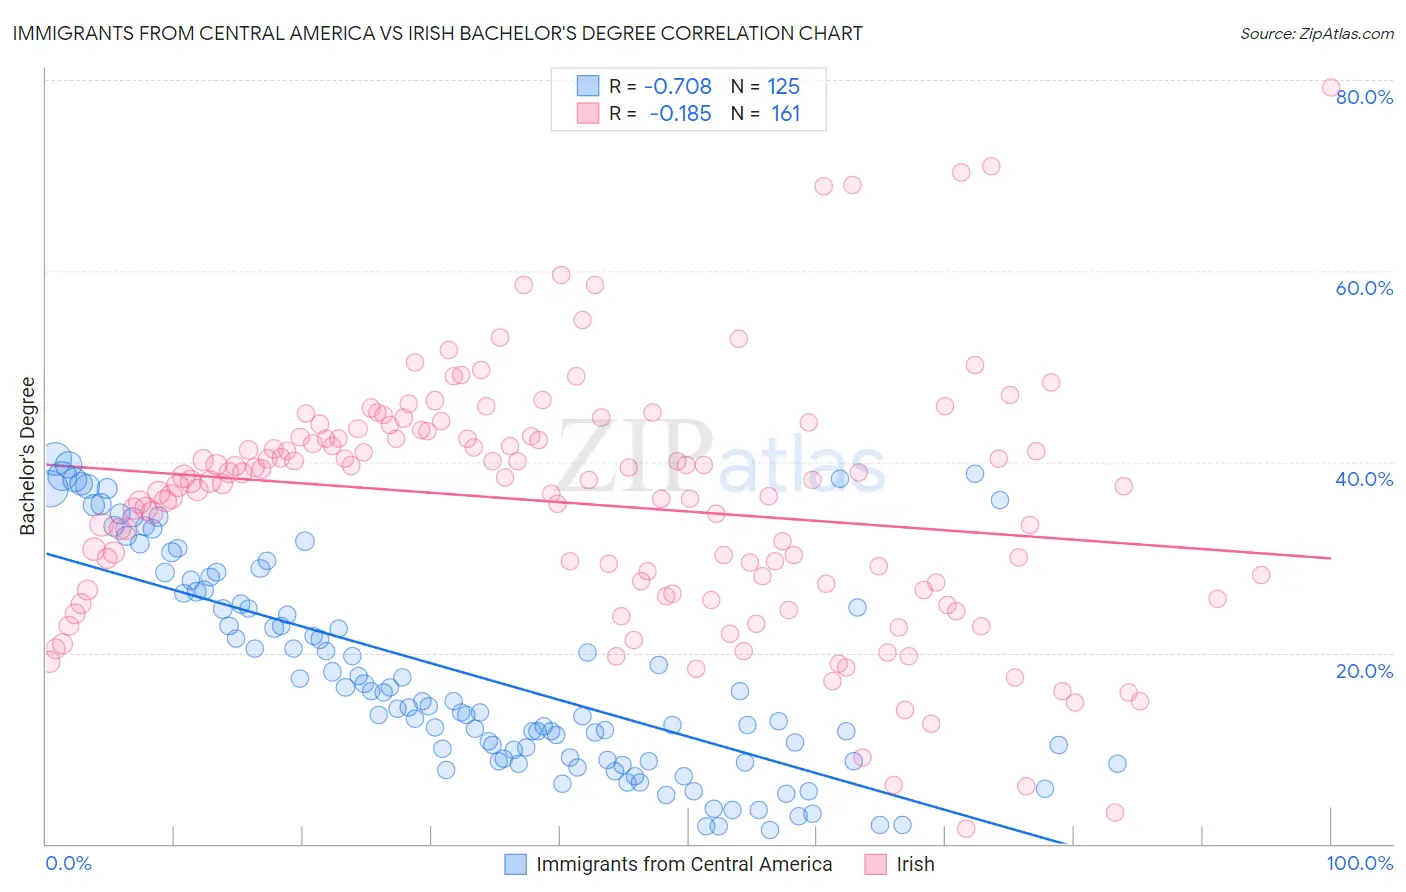
Immigrants from Central America vs Irish Bachelor's Degree Correlation Chart
The statistical analysis conducted on geographies consisting of 536,401,370 people shows a strong negative correlation between the proportion of Immigrants from Central America and percentage of population with at least bachelor's degree education in the United States with a correlation coefficient (R) of -0.708 and weighted average of 27.5%. Similarly, the statistical analysis conducted on geographies consisting of 580,386,909 people shows a poor negative correlation between the proportion of Irish and percentage of population with at least bachelor's degree education in the United States with a correlation coefficient (R) of -0.185 and weighted average of 37.6%, a difference of 36.9%.
Bachelor's Degree Correlation Summary
| Measurement | Immigrants from Central America | Irish |
| Minimum | 1.4% | 1.6% |
| Maximum | 40.3% | 79.2% |
| Range | 38.8% | 77.6% |
| Mean | 17.9% | 35.7% |
| Median | 14.9% | 37.9% |
| Interquartile 25% (IQ1) | 8.9% | 26.6% |
| Interquartile 75% (IQ3) | 26.5% | 42.6% |
| Interquartile Range (IQR) | 17.6% | 16.1% |
| Standard Deviation (Sample) | 10.9% | 13.0% |
| Standard Deviation (Population) | 10.9% | 13.0% |
Similar Demographics by Bachelor's Degree
Demographics Similar to Immigrants from Central America by Bachelor's Degree
In terms of bachelor's degree, the demographic groups most similar to Immigrants from Central America are Spanish American Indian (27.5%, a difference of 0.060%), Immigrants from the Azores (27.3%, a difference of 0.54%), Menominee (27.3%, a difference of 0.64%), Crow (27.7%, a difference of 1.0%), and Mexican (27.1%, a difference of 1.5%).
| Demographics | Rating | Rank | Bachelor's Degree |
| Tsimshian | 0.0 /100 | #322 | Tragic 28.8% |
| Fijians | 0.0 /100 | #323 | Tragic 28.7% |
| Dutch West Indians | 0.0 /100 | #324 | Tragic 28.5% |
| Pennsylvania Germans | 0.0 /100 | #325 | Tragic 28.4% |
| Apache | 0.0 /100 | #326 | Tragic 28.3% |
| Paiute | 0.0 /100 | #327 | Tragic 28.1% |
| Crow | 0.0 /100 | #328 | Tragic 27.7% |
| Immigrants | Central America | 0.0 /100 | #329 | Tragic 27.5% |
| Spanish American Indians | 0.0 /100 | #330 | Tragic 27.5% |
| Immigrants | Azores | 0.0 /100 | #331 | Tragic 27.3% |
| Menominee | 0.0 /100 | #332 | Tragic 27.3% |
| Mexicans | 0.0 /100 | #333 | Tragic 27.1% |
| Arapaho | 0.0 /100 | #334 | Tragic 26.6% |
| Natives/Alaskans | 0.0 /100 | #335 | Tragic 26.3% |
| Immigrants | Mexico | 0.0 /100 | #336 | Tragic 26.1% |
Demographics Similar to Irish by Bachelor's Degree
In terms of bachelor's degree, the demographic groups most similar to Irish are Immigrants from Senegal (37.6%, a difference of 0.050%), Immigrants from Bosnia and Herzegovina (37.6%, a difference of 0.090%), Immigrants from Colombia (37.7%, a difference of 0.11%), Senegalese (37.5%, a difference of 0.21%), and Immigrants from Cameroon (37.7%, a difference of 0.24%).
| Demographics | Rating | Rank | Bachelor's Degree |
| Immigrants | Iraq | 52.5 /100 | #173 | Average 37.9% |
| Immigrants | Bangladesh | 50.0 /100 | #174 | Average 37.8% |
| Immigrants | Uruguay | 48.3 /100 | #175 | Average 37.8% |
| Costa Ricans | 47.6 /100 | #176 | Average 37.7% |
| Basques | 47.4 /100 | #177 | Average 37.7% |
| Immigrants | Cameroon | 46.8 /100 | #178 | Average 37.7% |
| Immigrants | Colombia | 45.4 /100 | #179 | Average 37.7% |
| Irish | 44.3 /100 | #180 | Average 37.6% |
| Immigrants | Senegal | 43.8 /100 | #181 | Average 37.6% |
| Immigrants | Bosnia and Herzegovina | 43.4 /100 | #182 | Average 37.6% |
| Senegalese | 42.2 /100 | #183 | Average 37.5% |
| Scandinavians | 41.7 /100 | #184 | Average 37.5% |
| Immigrants | Peru | 41.3 /100 | #185 | Average 37.5% |
| Norwegians | 40.4 /100 | #186 | Average 37.5% |
| English | 39.7 /100 | #187 | Fair 37.4% |