Immigrants from Caribbean vs Lithuanian Doctorate Degree
COMPARE
Immigrants from Caribbean
Lithuanian
Doctorate Degree
Doctorate Degree Comparison
Immigrants from Caribbean
Lithuanians
1.3%
DOCTORATE DEGREE
0.0/ 100
METRIC RATING
333rd/ 347
METRIC RANK
2.3%
DOCTORATE DEGREE
99.8/ 100
METRIC RATING
70th/ 347
METRIC RANK
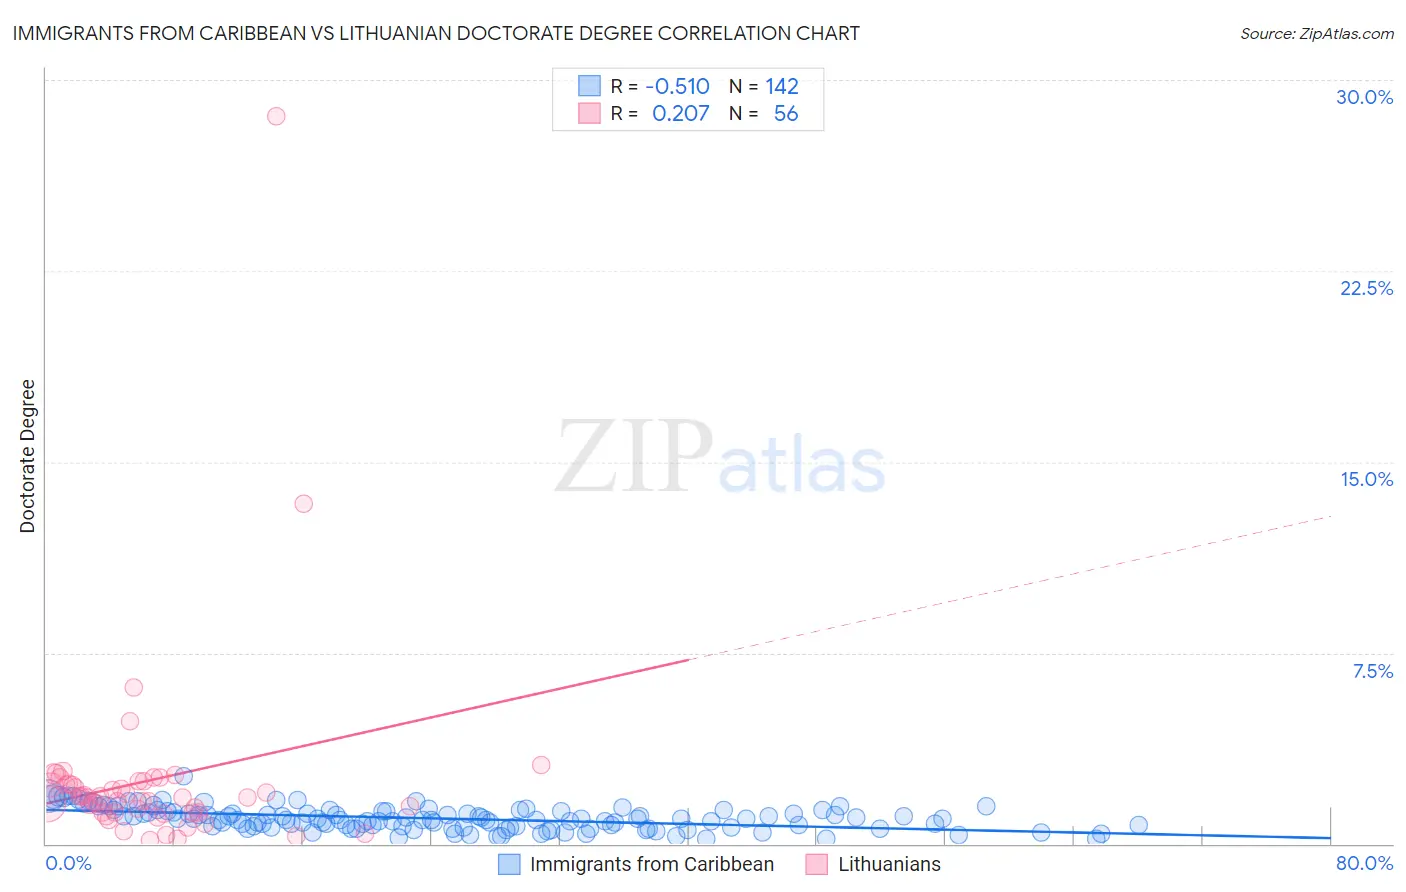
Immigrants from Caribbean vs Lithuanian Doctorate Degree Correlation Chart
The statistical analysis conducted on geographies consisting of 443,887,060 people shows a substantial negative correlation between the proportion of Immigrants from Caribbean and percentage of population with at least doctorate degree education in the United States with a correlation coefficient (R) of -0.510 and weighted average of 1.3%. Similarly, the statistical analysis conducted on geographies consisting of 417,147,177 people shows a weak positive correlation between the proportion of Lithuanians and percentage of population with at least doctorate degree education in the United States with a correlation coefficient (R) of 0.207 and weighted average of 2.3%, a difference of 76.3%.
Doctorate Degree Correlation Summary
| Measurement | Immigrants from Caribbean | Lithuanian |
| Minimum | 0.18% | 0.13% |
| Maximum | 2.6% | 28.6% |
| Range | 2.5% | 28.4% |
| Mean | 1.00% | 2.5% |
| Median | 0.96% | 1.8% |
| Interquartile 25% (IQ1) | 0.67% | 1.2% |
| Interquartile 75% (IQ3) | 1.3% | 2.4% |
| Interquartile Range (IQR) | 0.61% | 1.2% |
| Standard Deviation (Sample) | 0.44% | 4.0% |
| Standard Deviation (Population) | 0.44% | 4.0% |
Similar Demographics by Doctorate Degree
Demographics Similar to Immigrants from Caribbean by Doctorate Degree
In terms of doctorate degree, the demographic groups most similar to Immigrants from Caribbean are Yakama (1.3%, a difference of 0.16%), Immigrants from Dominican Republic (1.3%, a difference of 0.19%), Immigrants from Latin America (1.3%, a difference of 1.7%), Yup'ik (1.3%, a difference of 1.8%), and Haitian (1.3%, a difference of 2.0%).
| Demographics | Rating | Rank | Doctorate Degree |
| Immigrants | Cabo Verde | 0.0 /100 | #326 | Tragic 1.3% |
| Hispanics or Latinos | 0.0 /100 | #327 | Tragic 1.3% |
| Inupiat | 0.0 /100 | #328 | Tragic 1.3% |
| Haitians | 0.0 /100 | #329 | Tragic 1.3% |
| Yup'ik | 0.0 /100 | #330 | Tragic 1.3% |
| Immigrants | Latin America | 0.0 /100 | #331 | Tragic 1.3% |
| Yakama | 0.0 /100 | #332 | Tragic 1.3% |
| Immigrants | Caribbean | 0.0 /100 | #333 | Tragic 1.3% |
| Immigrants | Dominican Republic | 0.0 /100 | #334 | Tragic 1.3% |
| Immigrants | Haiti | 0.0 /100 | #335 | Tragic 1.3% |
| Nepalese | 0.0 /100 | #336 | Tragic 1.3% |
| Bangladeshis | 0.0 /100 | #337 | Tragic 1.2% |
| Puget Sound Salish | 0.0 /100 | #338 | Tragic 1.2% |
| Immigrants | Central America | 0.0 /100 | #339 | Tragic 1.2% |
| Immigrants | Cuba | 0.0 /100 | #340 | Tragic 1.2% |
Demographics Similar to Lithuanians by Doctorate Degree
In terms of doctorate degree, the demographic groups most similar to Lithuanians are Immigrants from Bolivia (2.3%, a difference of 0.0%), Carpatho Rusyn (2.3%, a difference of 0.14%), Immigrants from Canada (2.3%, a difference of 0.16%), Immigrants from Bulgaria (2.3%, a difference of 0.24%), and Immigrants from North America (2.2%, a difference of 0.38%).
| Demographics | Rating | Rank | Doctorate Degree |
| Laotians | 99.9 /100 | #63 | Exceptional 2.3% |
| Immigrants | Greece | 99.9 /100 | #64 | Exceptional 2.3% |
| Paraguayans | 99.9 /100 | #65 | Exceptional 2.3% |
| Argentineans | 99.9 /100 | #66 | Exceptional 2.3% |
| Zimbabweans | 99.8 /100 | #67 | Exceptional 2.3% |
| Immigrants | Kazakhstan | 99.8 /100 | #68 | Exceptional 2.3% |
| Carpatho Rusyns | 99.8 /100 | #69 | Exceptional 2.3% |
| Lithuanians | 99.8 /100 | #70 | Exceptional 2.3% |
| Immigrants | Bolivia | 99.8 /100 | #71 | Exceptional 2.3% |
| Immigrants | Canada | 99.8 /100 | #72 | Exceptional 2.3% |
| Immigrants | Bulgaria | 99.8 /100 | #73 | Exceptional 2.3% |
| Immigrants | North America | 99.8 /100 | #74 | Exceptional 2.2% |
| Immigrants | Western Asia | 99.8 /100 | #75 | Exceptional 2.2% |
| Immigrants | Hungary | 99.8 /100 | #76 | Exceptional 2.2% |
| Immigrants | Lebanon | 99.8 /100 | #77 | Exceptional 2.2% |