Immigrants from Caribbean vs African Doctorate Degree
COMPARE
Immigrants from Caribbean
African
Doctorate Degree
Doctorate Degree Comparison
Immigrants from Caribbean
Africans
1.3%
DOCTORATE DEGREE
0.0/ 100
METRIC RATING
333rd/ 347
METRIC RANK
1.6%
DOCTORATE DEGREE
1.8/ 100
METRIC RATING
248th/ 347
METRIC RANK
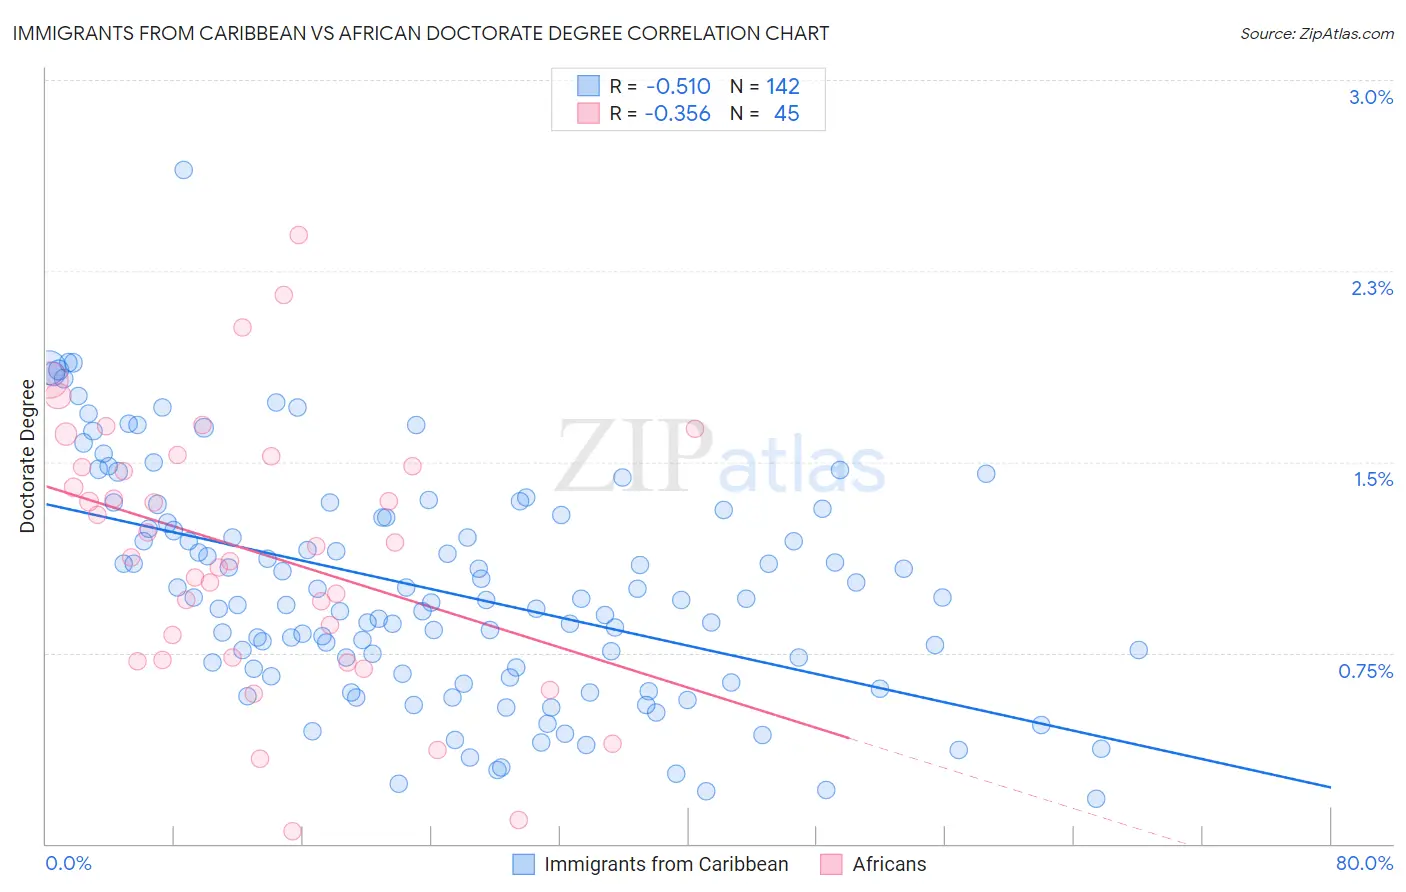
Immigrants from Caribbean vs African Doctorate Degree Correlation Chart
The statistical analysis conducted on geographies consisting of 443,887,060 people shows a substantial negative correlation between the proportion of Immigrants from Caribbean and percentage of population with at least doctorate degree education in the United States with a correlation coefficient (R) of -0.510 and weighted average of 1.3%. Similarly, the statistical analysis conducted on geographies consisting of 461,393,656 people shows a mild negative correlation between the proportion of Africans and percentage of population with at least doctorate degree education in the United States with a correlation coefficient (R) of -0.356 and weighted average of 1.6%, a difference of 22.4%.
Doctorate Degree Correlation Summary
| Measurement | Immigrants from Caribbean | African |
| Minimum | 0.18% | 0.049% |
| Maximum | 2.6% | 2.4% |
| Range | 2.5% | 2.3% |
| Mean | 1.00% | 1.2% |
| Median | 0.96% | 1.2% |
| Interquartile 25% (IQ1) | 0.67% | 0.73% |
| Interquartile 75% (IQ3) | 1.3% | 1.5% |
| Interquartile Range (IQR) | 0.61% | 0.78% |
| Standard Deviation (Sample) | 0.44% | 0.52% |
| Standard Deviation (Population) | 0.44% | 0.52% |
Similar Demographics by Doctorate Degree
Demographics Similar to Immigrants from Caribbean by Doctorate Degree
In terms of doctorate degree, the demographic groups most similar to Immigrants from Caribbean are Yakama (1.3%, a difference of 0.16%), Immigrants from Dominican Republic (1.3%, a difference of 0.19%), Immigrants from Latin America (1.3%, a difference of 1.7%), Yup'ik (1.3%, a difference of 1.8%), and Haitian (1.3%, a difference of 2.0%).
| Demographics | Rating | Rank | Doctorate Degree |
| Immigrants | Cabo Verde | 0.0 /100 | #326 | Tragic 1.3% |
| Hispanics or Latinos | 0.0 /100 | #327 | Tragic 1.3% |
| Inupiat | 0.0 /100 | #328 | Tragic 1.3% |
| Haitians | 0.0 /100 | #329 | Tragic 1.3% |
| Yup'ik | 0.0 /100 | #330 | Tragic 1.3% |
| Immigrants | Latin America | 0.0 /100 | #331 | Tragic 1.3% |
| Yakama | 0.0 /100 | #332 | Tragic 1.3% |
| Immigrants | Caribbean | 0.0 /100 | #333 | Tragic 1.3% |
| Immigrants | Dominican Republic | 0.0 /100 | #334 | Tragic 1.3% |
| Immigrants | Haiti | 0.0 /100 | #335 | Tragic 1.3% |
| Nepalese | 0.0 /100 | #336 | Tragic 1.3% |
| Bangladeshis | 0.0 /100 | #337 | Tragic 1.2% |
| Puget Sound Salish | 0.0 /100 | #338 | Tragic 1.2% |
| Immigrants | Central America | 0.0 /100 | #339 | Tragic 1.2% |
| Immigrants | Cuba | 0.0 /100 | #340 | Tragic 1.2% |
Demographics Similar to Africans by Doctorate Degree
In terms of doctorate degree, the demographic groups most similar to Africans are Comanche (1.6%, a difference of 0.12%), Hmong (1.6%, a difference of 0.14%), Delaware (1.6%, a difference of 0.23%), Potawatomi (1.6%, a difference of 0.47%), and Immigrants from Fiji (1.6%, a difference of 0.50%).
| Demographics | Rating | Rank | Doctorate Degree |
| Cheyenne | 2.3 /100 | #241 | Tragic 1.6% |
| Ottawa | 2.2 /100 | #242 | Tragic 1.6% |
| Native Hawaiians | 2.1 /100 | #243 | Tragic 1.6% |
| French American Indians | 2.0 /100 | #244 | Tragic 1.6% |
| Delaware | 1.9 /100 | #245 | Tragic 1.6% |
| Hmong | 1.8 /100 | #246 | Tragic 1.6% |
| Comanche | 1.8 /100 | #247 | Tragic 1.6% |
| Africans | 1.8 /100 | #248 | Tragic 1.6% |
| Potawatomi | 1.6 /100 | #249 | Tragic 1.6% |
| Immigrants | Fiji | 1.6 /100 | #250 | Tragic 1.6% |
| Apache | 1.3 /100 | #251 | Tragic 1.5% |
| Yuman | 1.1 /100 | #252 | Tragic 1.5% |
| Americans | 1.0 /100 | #253 | Tragic 1.5% |
| Immigrants | Cambodia | 1.0 /100 | #254 | Tragic 1.5% |
| Trinidadians and Tobagonians | 1.0 /100 | #255 | Tragic 1.5% |