Immigrants from Caribbean vs German Russian Doctorate Degree
COMPARE
Immigrants from Caribbean
German Russian
Doctorate Degree
Doctorate Degree Comparison
Immigrants from Caribbean
German Russians
1.3%
DOCTORATE DEGREE
0.0/ 100
METRIC RATING
333rd/ 347
METRIC RANK
1.8%
DOCTORATE DEGREE
27.1/ 100
METRIC RATING
193rd/ 347
METRIC RANK
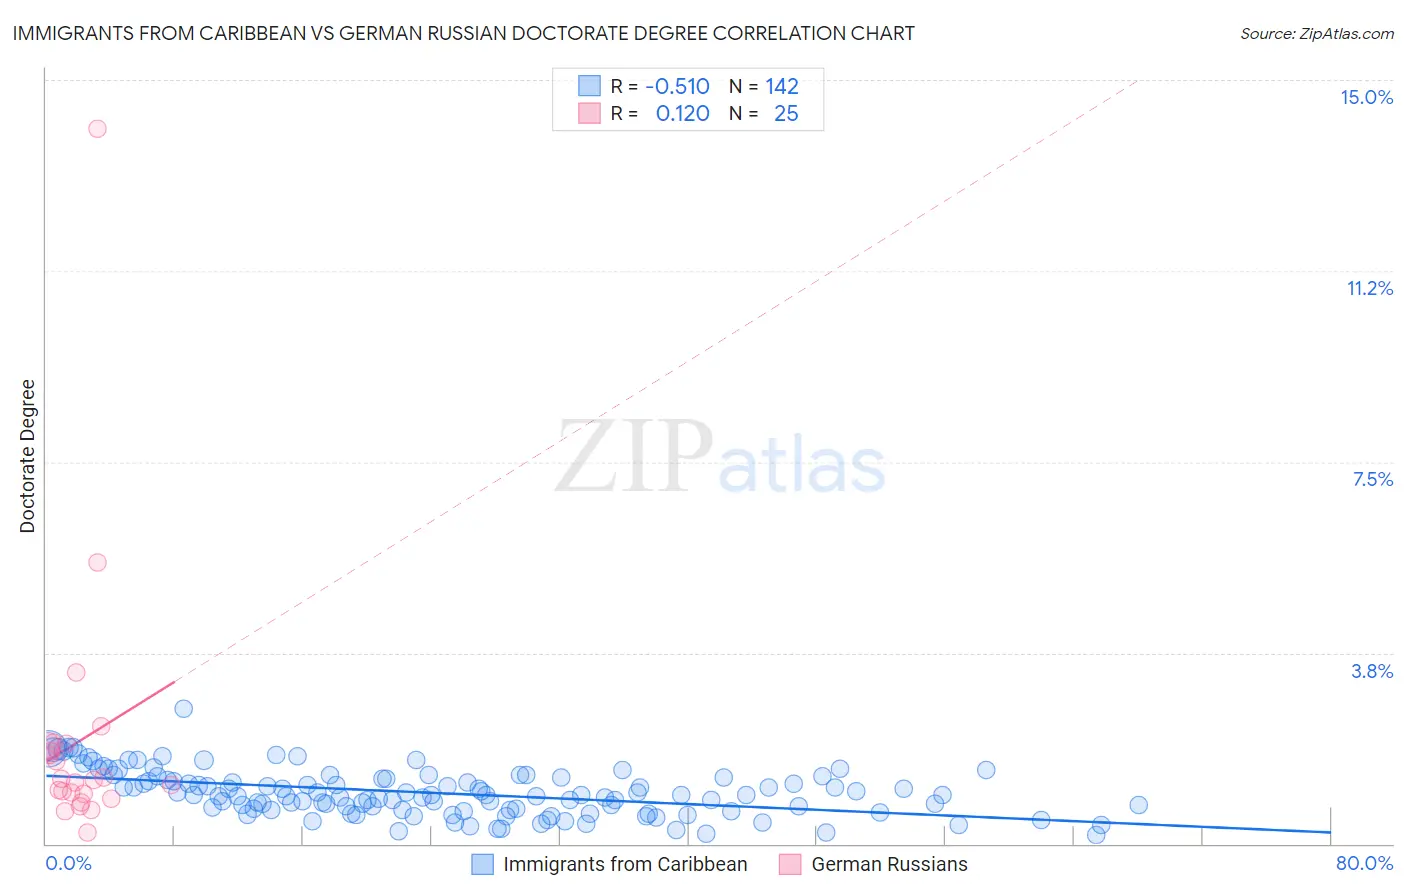
Immigrants from Caribbean vs German Russian Doctorate Degree Correlation Chart
The statistical analysis conducted on geographies consisting of 443,887,060 people shows a substantial negative correlation between the proportion of Immigrants from Caribbean and percentage of population with at least doctorate degree education in the United States with a correlation coefficient (R) of -0.510 and weighted average of 1.3%. Similarly, the statistical analysis conducted on geographies consisting of 96,106,122 people shows a poor positive correlation between the proportion of German Russians and percentage of population with at least doctorate degree education in the United States with a correlation coefficient (R) of 0.120 and weighted average of 1.8%, a difference of 38.3%.
Doctorate Degree Correlation Summary
| Measurement | Immigrants from Caribbean | German Russian |
| Minimum | 0.18% | 0.22% |
| Maximum | 2.6% | 14.0% |
| Range | 2.5% | 13.8% |
| Mean | 1.00% | 2.0% |
| Median | 0.96% | 1.3% |
| Interquartile 25% (IQ1) | 0.67% | 0.92% |
| Interquartile 75% (IQ3) | 1.3% | 1.9% |
| Interquartile Range (IQR) | 0.61% | 1.0% |
| Standard Deviation (Sample) | 0.44% | 2.7% |
| Standard Deviation (Population) | 0.44% | 2.7% |
Similar Demographics by Doctorate Degree
Demographics Similar to Immigrants from Caribbean by Doctorate Degree
In terms of doctorate degree, the demographic groups most similar to Immigrants from Caribbean are Yakama (1.3%, a difference of 0.16%), Immigrants from Dominican Republic (1.3%, a difference of 0.19%), Immigrants from Latin America (1.3%, a difference of 1.7%), Yup'ik (1.3%, a difference of 1.8%), and Haitian (1.3%, a difference of 2.0%).
| Demographics | Rating | Rank | Doctorate Degree |
| Immigrants | Cabo Verde | 0.0 /100 | #326 | Tragic 1.3% |
| Hispanics or Latinos | 0.0 /100 | #327 | Tragic 1.3% |
| Inupiat | 0.0 /100 | #328 | Tragic 1.3% |
| Haitians | 0.0 /100 | #329 | Tragic 1.3% |
| Yup'ik | 0.0 /100 | #330 | Tragic 1.3% |
| Immigrants | Latin America | 0.0 /100 | #331 | Tragic 1.3% |
| Yakama | 0.0 /100 | #332 | Tragic 1.3% |
| Immigrants | Caribbean | 0.0 /100 | #333 | Tragic 1.3% |
| Immigrants | Dominican Republic | 0.0 /100 | #334 | Tragic 1.3% |
| Immigrants | Haiti | 0.0 /100 | #335 | Tragic 1.3% |
| Nepalese | 0.0 /100 | #336 | Tragic 1.3% |
| Bangladeshis | 0.0 /100 | #337 | Tragic 1.2% |
| Puget Sound Salish | 0.0 /100 | #338 | Tragic 1.2% |
| Immigrants | Central America | 0.0 /100 | #339 | Tragic 1.2% |
| Immigrants | Cuba | 0.0 /100 | #340 | Tragic 1.2% |
Demographics Similar to German Russians by Doctorate Degree
In terms of doctorate degree, the demographic groups most similar to German Russians are Dutch (1.8%, a difference of 0.070%), Uruguayan (1.8%, a difference of 0.17%), Immigrants from Somalia (1.8%, a difference of 0.33%), Subsaharan African (1.8%, a difference of 0.40%), and Chinese (1.8%, a difference of 0.40%).
| Demographics | Rating | Rank | Doctorate Degree |
| Peruvians | 34.4 /100 | #186 | Fair 1.8% |
| Czechoslovakians | 33.0 /100 | #187 | Fair 1.8% |
| Germans | 30.5 /100 | #188 | Fair 1.8% |
| French Canadians | 30.2 /100 | #189 | Fair 1.8% |
| Immigrants | Costa Rica | 30.2 /100 | #190 | Fair 1.8% |
| South Americans | 29.5 /100 | #191 | Fair 1.8% |
| Dutch | 27.4 /100 | #192 | Fair 1.8% |
| German Russians | 27.1 /100 | #193 | Fair 1.8% |
| Uruguayans | 26.2 /100 | #194 | Fair 1.8% |
| Immigrants | Somalia | 25.4 /100 | #195 | Fair 1.8% |
| Sub-Saharan Africans | 25.1 /100 | #196 | Fair 1.8% |
| Chinese | 25.1 /100 | #197 | Fair 1.8% |
| Immigrants | Ghana | 24.6 /100 | #198 | Fair 1.8% |
| Immigrants | South America | 23.3 /100 | #199 | Fair 1.8% |
| Whites/Caucasians | 22.8 /100 | #200 | Fair 1.8% |