Immigrants from Costa Rica vs Tongan Doctorate Degree
COMPARE
Immigrants from Costa Rica
Tongan
Doctorate Degree
Doctorate Degree Comparison
Immigrants from Costa Rica
Tongans
1.8%
DOCTORATE DEGREE
30.2/ 100
METRIC RATING
190th/ 347
METRIC RANK
1.7%
DOCTORATE DEGREE
15.1/ 100
METRIC RATING
210th/ 347
METRIC RANK
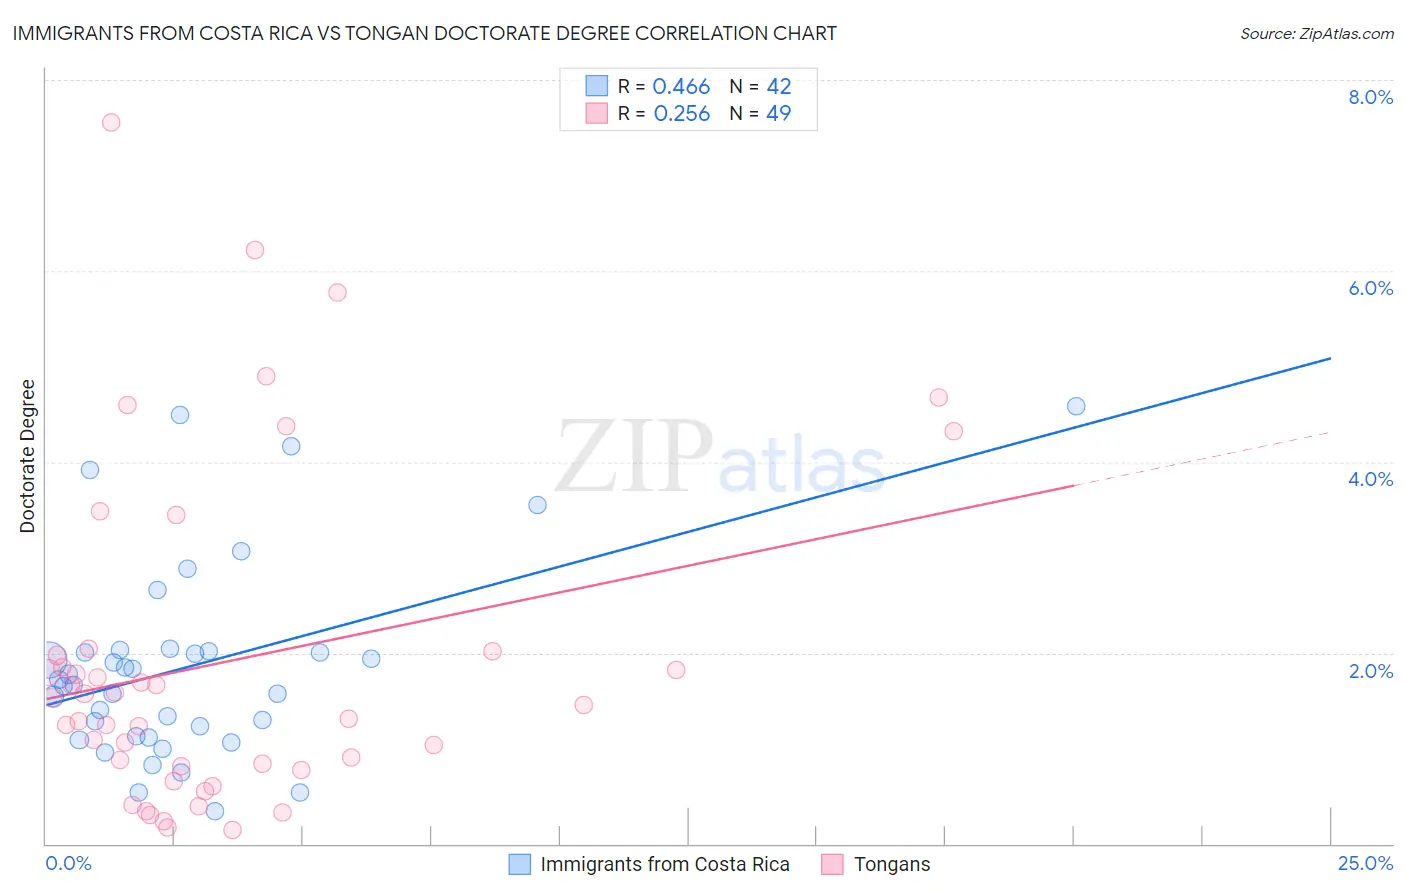
Immigrants from Costa Rica vs Tongan Doctorate Degree Correlation Chart
The statistical analysis conducted on geographies consisting of 203,508,401 people shows a moderate positive correlation between the proportion of Immigrants from Costa Rica and percentage of population with at least doctorate degree education in the United States with a correlation coefficient (R) of 0.466 and weighted average of 1.8%. Similarly, the statistical analysis conducted on geographies consisting of 102,428,868 people shows a weak positive correlation between the proportion of Tongans and percentage of population with at least doctorate degree education in the United States with a correlation coefficient (R) of 0.256 and weighted average of 1.7%, a difference of 3.5%.
Doctorate Degree Correlation Summary
| Measurement | Immigrants from Costa Rica | Tongan |
| Minimum | 0.34% | 0.15% |
| Maximum | 4.6% | 7.5% |
| Range | 4.2% | 7.4% |
| Mean | 1.9% | 1.9% |
| Median | 1.7% | 1.4% |
| Interquartile 25% (IQ1) | 1.1% | 0.79% |
| Interquartile 75% (IQ3) | 2.0% | 2.0% |
| Interquartile Range (IQR) | 0.89% | 1.2% |
| Standard Deviation (Sample) | 1.0% | 1.7% |
| Standard Deviation (Population) | 1.0% | 1.7% |
Demographics Similar to Immigrants from Costa Rica and Tongans by Doctorate Degree
In terms of doctorate degree, the demographic groups most similar to Immigrants from Costa Rica are South American (1.8%, a difference of 0.12%), Dutch (1.8%, a difference of 0.51%), German Russian (1.8%, a difference of 0.57%), Uruguayan (1.8%, a difference of 0.75%), and Immigrants from Somalia (1.8%, a difference of 0.90%). Similarly, the demographic groups most similar to Tongans are Immigrants from Western Africa (1.7%, a difference of 0.080%), Colombian (1.7%, a difference of 0.27%), Yugoslavian (1.7%, a difference of 0.56%), Immigrants from Peru (1.7%, a difference of 0.71%), and Venezuelan (1.7%, a difference of 1.2%).
| Demographics | Rating | Rank | Doctorate Degree |
| Immigrants | Costa Rica | 30.2 /100 | #190 | Fair 1.8% |
| South Americans | 29.5 /100 | #191 | Fair 1.8% |
| Dutch | 27.4 /100 | #192 | Fair 1.8% |
| German Russians | 27.1 /100 | #193 | Fair 1.8% |
| Uruguayans | 26.2 /100 | #194 | Fair 1.8% |
| Immigrants | Somalia | 25.4 /100 | #195 | Fair 1.8% |
| Sub-Saharan Africans | 25.1 /100 | #196 | Fair 1.8% |
| Chinese | 25.1 /100 | #197 | Fair 1.8% |
| Immigrants | Ghana | 24.6 /100 | #198 | Fair 1.8% |
| Immigrants | South America | 23.3 /100 | #199 | Fair 1.8% |
| Whites/Caucasians | 22.8 /100 | #200 | Fair 1.8% |
| Immigrants | Nigeria | 22.4 /100 | #201 | Fair 1.8% |
| Portuguese | 21.4 /100 | #202 | Fair 1.8% |
| Immigrants | Vietnam | 21.4 /100 | #203 | Fair 1.8% |
| Somalis | 21.2 /100 | #204 | Fair 1.7% |
| Venezuelans | 19.5 /100 | #205 | Poor 1.7% |
| Immigrants | Peru | 17.6 /100 | #206 | Poor 1.7% |
| Yugoslavians | 17.1 /100 | #207 | Poor 1.7% |
| Colombians | 16.1 /100 | #208 | Poor 1.7% |
| Immigrants | Western Africa | 15.4 /100 | #209 | Poor 1.7% |
| Tongans | 15.1 /100 | #210 | Poor 1.7% |