Egyptian vs Lithuanian Doctorate Degree
COMPARE
Egyptian
Lithuanian
Doctorate Degree
Doctorate Degree Comparison
Egyptians
Lithuanians
2.2%
DOCTORATE DEGREE
99.4/ 100
METRIC RATING
86th/ 347
METRIC RANK
2.3%
DOCTORATE DEGREE
99.8/ 100
METRIC RATING
70th/ 347
METRIC RANK
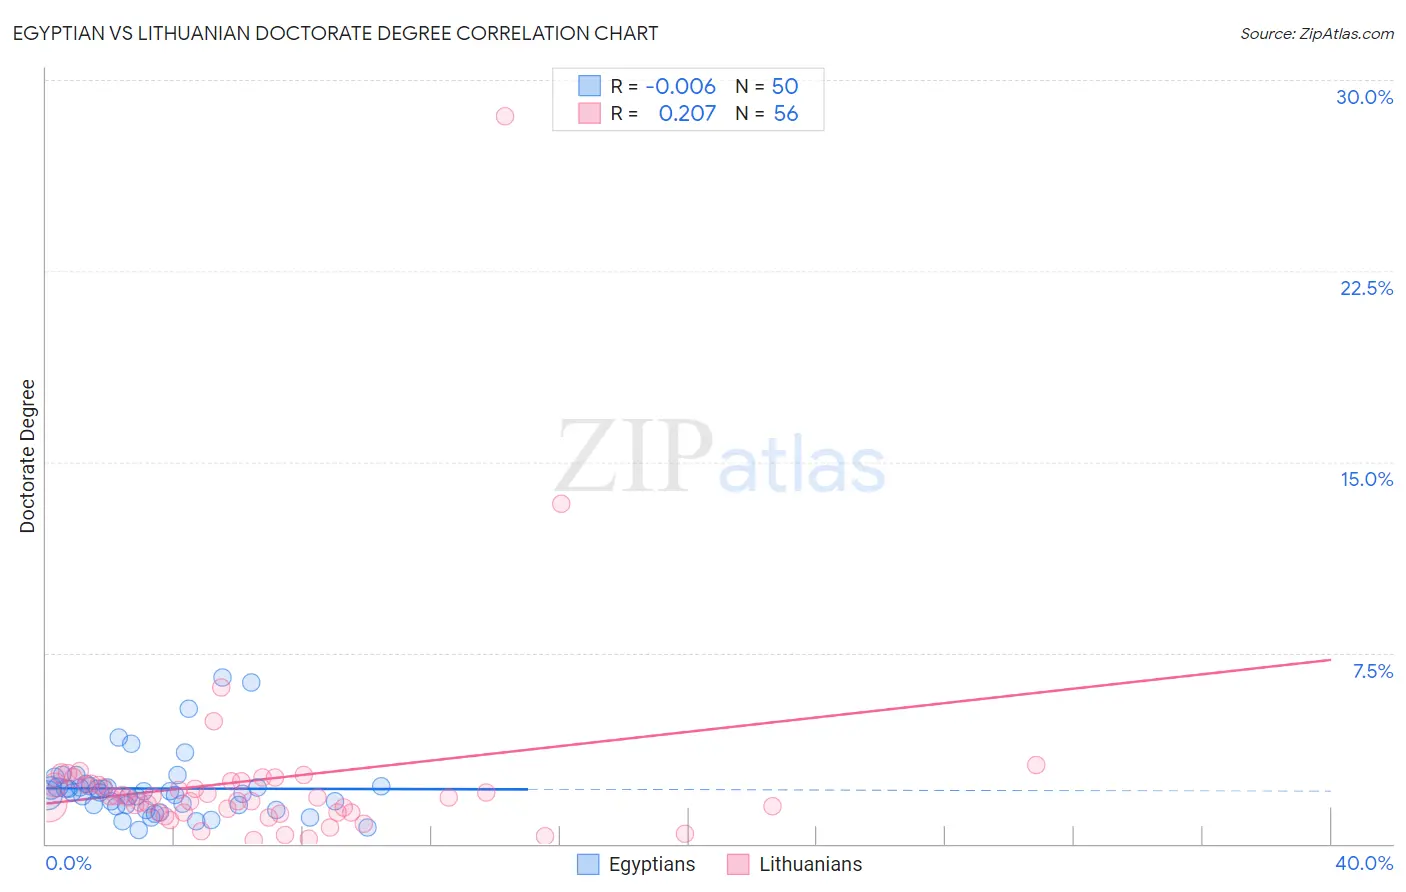
Egyptian vs Lithuanian Doctorate Degree Correlation Chart
The statistical analysis conducted on geographies consisting of 275,731,799 people shows no correlation between the proportion of Egyptians and percentage of population with at least doctorate degree education in the United States with a correlation coefficient (R) of -0.006 and weighted average of 2.2%. Similarly, the statistical analysis conducted on geographies consisting of 417,147,177 people shows a weak positive correlation between the proportion of Lithuanians and percentage of population with at least doctorate degree education in the United States with a correlation coefficient (R) of 0.207 and weighted average of 2.3%, a difference of 3.2%.
Doctorate Degree Correlation Summary
| Measurement | Egyptian | Lithuanian |
| Minimum | 0.53% | 0.13% |
| Maximum | 6.5% | 28.6% |
| Range | 6.0% | 28.4% |
| Mean | 2.2% | 2.5% |
| Median | 2.0% | 1.8% |
| Interquartile 25% (IQ1) | 1.5% | 1.2% |
| Interquartile 75% (IQ3) | 2.2% | 2.4% |
| Interquartile Range (IQR) | 0.72% | 1.2% |
| Standard Deviation (Sample) | 1.2% | 4.0% |
| Standard Deviation (Population) | 1.2% | 4.0% |
Demographics Similar to Egyptians and Lithuanians by Doctorate Degree
In terms of doctorate degree, the demographic groups most similar to Egyptians are Immigrants from Zimbabwe (2.2%, a difference of 0.11%), Immigrants from Nepal (2.2%, a difference of 0.47%), Immigrants from Brazil (2.2%, a difference of 0.70%), Immigrants from England (2.2%, a difference of 0.83%), and Immigrants from Lithuania (2.2%, a difference of 0.98%). Similarly, the demographic groups most similar to Lithuanians are Immigrants from Bolivia (2.3%, a difference of 0.0%), Carpatho Rusyn (2.3%, a difference of 0.14%), Immigrants from Canada (2.3%, a difference of 0.16%), Immigrants from Bulgaria (2.3%, a difference of 0.24%), and Immigrants from North America (2.2%, a difference of 0.38%).
| Demographics | Rating | Rank | Doctorate Degree |
| Immigrants | Kazakhstan | 99.8 /100 | #68 | Exceptional 2.3% |
| Carpatho Rusyns | 99.8 /100 | #69 | Exceptional 2.3% |
| Lithuanians | 99.8 /100 | #70 | Exceptional 2.3% |
| Immigrants | Bolivia | 99.8 /100 | #71 | Exceptional 2.3% |
| Immigrants | Canada | 99.8 /100 | #72 | Exceptional 2.3% |
| Immigrants | Bulgaria | 99.8 /100 | #73 | Exceptional 2.3% |
| Immigrants | North America | 99.8 /100 | #74 | Exceptional 2.2% |
| Immigrants | Western Asia | 99.8 /100 | #75 | Exceptional 2.2% |
| Immigrants | Hungary | 99.8 /100 | #76 | Exceptional 2.2% |
| Immigrants | Lebanon | 99.8 /100 | #77 | Exceptional 2.2% |
| Immigrants | Belarus | 99.7 /100 | #78 | Exceptional 2.2% |
| Northern Europeans | 99.7 /100 | #79 | Exceptional 2.2% |
| Ugandans | 99.7 /100 | #80 | Exceptional 2.2% |
| Immigrants | Argentina | 99.7 /100 | #81 | Exceptional 2.2% |
| Immigrants | Uganda | 99.6 /100 | #82 | Exceptional 2.2% |
| Immigrants | Lithuania | 99.6 /100 | #83 | Exceptional 2.2% |
| Immigrants | England | 99.6 /100 | #84 | Exceptional 2.2% |
| Immigrants | Brazil | 99.6 /100 | #85 | Exceptional 2.2% |
| Egyptians | 99.4 /100 | #86 | Exceptional 2.2% |
| Immigrants | Zimbabwe | 99.4 /100 | #87 | Exceptional 2.2% |
| Immigrants | Nepal | 99.3 /100 | #88 | Exceptional 2.2% |