Pima vs Lithuanian Doctorate Degree
COMPARE
Pima
Lithuanian
Doctorate Degree
Doctorate Degree Comparison
Pima
Lithuanians
1.3%
DOCTORATE DEGREE
0.0/ 100
METRIC RATING
325th/ 347
METRIC RANK
2.3%
DOCTORATE DEGREE
99.8/ 100
METRIC RATING
70th/ 347
METRIC RANK
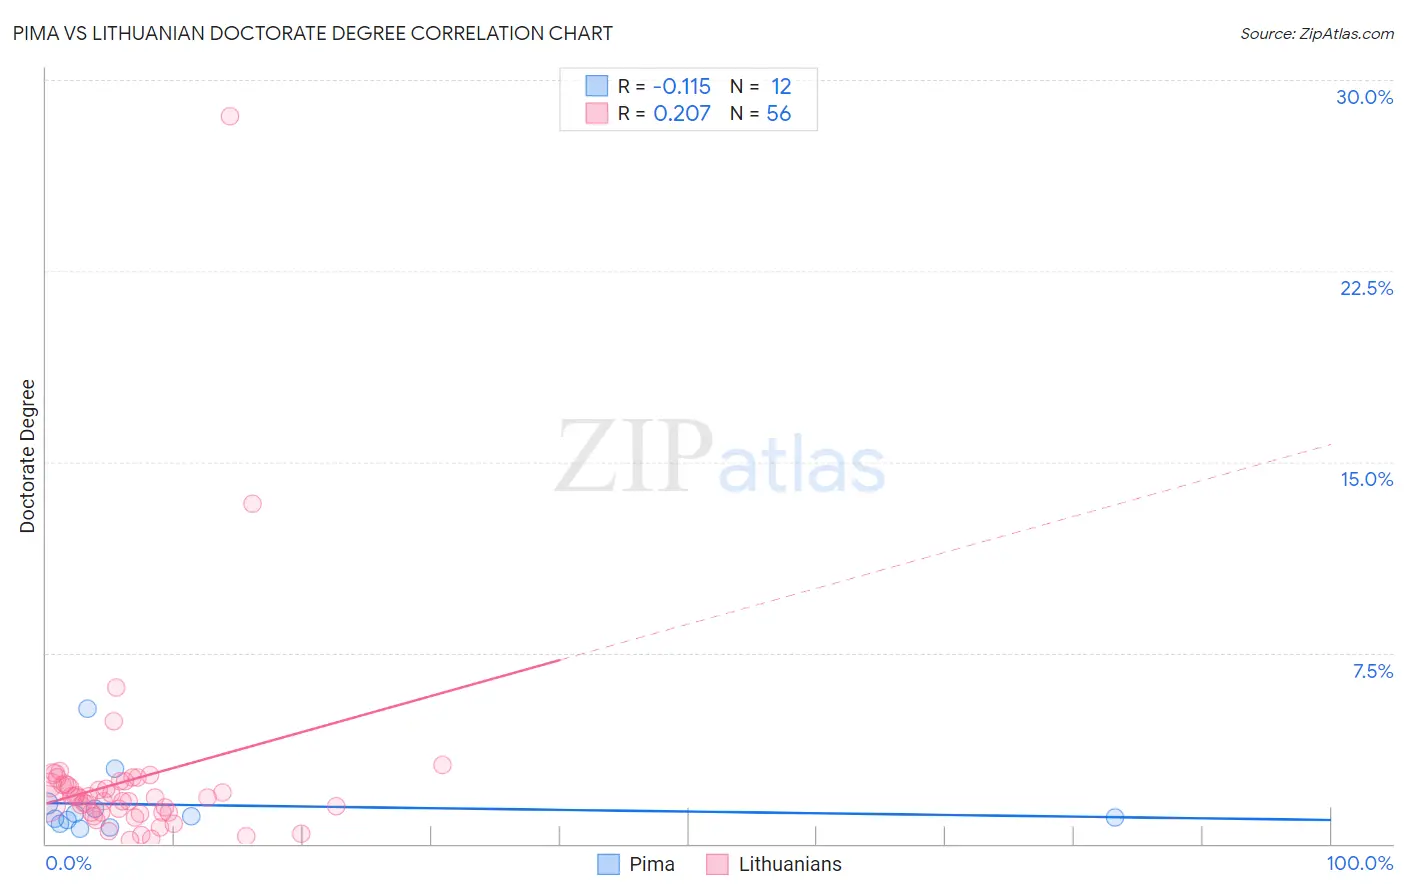
Pima vs Lithuanian Doctorate Degree Correlation Chart
The statistical analysis conducted on geographies consisting of 61,222,520 people shows a poor negative correlation between the proportion of Pima and percentage of population with at least doctorate degree education in the United States with a correlation coefficient (R) of -0.115 and weighted average of 1.3%. Similarly, the statistical analysis conducted on geographies consisting of 417,147,177 people shows a weak positive correlation between the proportion of Lithuanians and percentage of population with at least doctorate degree education in the United States with a correlation coefficient (R) of 0.207 and weighted average of 2.3%, a difference of 71.2%.
Doctorate Degree Correlation Summary
| Measurement | Pima | Lithuanian |
| Minimum | 0.59% | 0.13% |
| Maximum | 5.3% | 28.6% |
| Range | 4.7% | 28.4% |
| Mean | 1.5% | 2.5% |
| Median | 1.0% | 1.8% |
| Interquartile 25% (IQ1) | 0.85% | 1.2% |
| Interquartile 75% (IQ3) | 1.5% | 2.4% |
| Interquartile Range (IQR) | 0.64% | 1.2% |
| Standard Deviation (Sample) | 1.3% | 4.0% |
| Standard Deviation (Population) | 1.3% | 4.0% |
Similar Demographics by Doctorate Degree
Demographics Similar to Pima by Doctorate Degree
In terms of doctorate degree, the demographic groups most similar to Pima are Immigrants from Cabo Verde (1.3%, a difference of 0.020%), Hispanic or Latino (1.3%, a difference of 0.31%), Native/Alaskan (1.3%, a difference of 0.39%), Immigrants from Belize (1.3%, a difference of 0.72%), and Inupiat (1.3%, a difference of 0.89%).
| Demographics | Rating | Rank | Doctorate Degree |
| Creek | 0.1 /100 | #318 | Tragic 1.3% |
| Immigrants | Guyana | 0.1 /100 | #319 | Tragic 1.3% |
| Immigrants | St. Vincent and the Grenadines | 0.1 /100 | #320 | Tragic 1.3% |
| Dutch West Indians | 0.1 /100 | #321 | Tragic 1.3% |
| Seminole | 0.1 /100 | #322 | Tragic 1.3% |
| Immigrants | Belize | 0.1 /100 | #323 | Tragic 1.3% |
| Natives/Alaskans | 0.0 /100 | #324 | Tragic 1.3% |
| Pima | 0.0 /100 | #325 | Tragic 1.3% |
| Immigrants | Cabo Verde | 0.0 /100 | #326 | Tragic 1.3% |
| Hispanics or Latinos | 0.0 /100 | #327 | Tragic 1.3% |
| Inupiat | 0.0 /100 | #328 | Tragic 1.3% |
| Haitians | 0.0 /100 | #329 | Tragic 1.3% |
| Yup'ik | 0.0 /100 | #330 | Tragic 1.3% |
| Immigrants | Latin America | 0.0 /100 | #331 | Tragic 1.3% |
| Yakama | 0.0 /100 | #332 | Tragic 1.3% |
Demographics Similar to Lithuanians by Doctorate Degree
In terms of doctorate degree, the demographic groups most similar to Lithuanians are Immigrants from Bolivia (2.3%, a difference of 0.0%), Carpatho Rusyn (2.3%, a difference of 0.14%), Immigrants from Canada (2.3%, a difference of 0.16%), Immigrants from Bulgaria (2.3%, a difference of 0.24%), and Immigrants from North America (2.2%, a difference of 0.38%).
| Demographics | Rating | Rank | Doctorate Degree |
| Laotians | 99.9 /100 | #63 | Exceptional 2.3% |
| Immigrants | Greece | 99.9 /100 | #64 | Exceptional 2.3% |
| Paraguayans | 99.9 /100 | #65 | Exceptional 2.3% |
| Argentineans | 99.9 /100 | #66 | Exceptional 2.3% |
| Zimbabweans | 99.8 /100 | #67 | Exceptional 2.3% |
| Immigrants | Kazakhstan | 99.8 /100 | #68 | Exceptional 2.3% |
| Carpatho Rusyns | 99.8 /100 | #69 | Exceptional 2.3% |
| Lithuanians | 99.8 /100 | #70 | Exceptional 2.3% |
| Immigrants | Bolivia | 99.8 /100 | #71 | Exceptional 2.3% |
| Immigrants | Canada | 99.8 /100 | #72 | Exceptional 2.3% |
| Immigrants | Bulgaria | 99.8 /100 | #73 | Exceptional 2.3% |
| Immigrants | North America | 99.8 /100 | #74 | Exceptional 2.2% |
| Immigrants | Western Asia | 99.8 /100 | #75 | Exceptional 2.2% |
| Immigrants | Hungary | 99.8 /100 | #76 | Exceptional 2.2% |
| Immigrants | Lebanon | 99.8 /100 | #77 | Exceptional 2.2% |