Immigrants from Caribbean vs Welsh Master's Degree
COMPARE
Immigrants from Caribbean
Welsh
Master's Degree
Master's Degree Comparison
Immigrants from Caribbean
Welsh
12.1%
MASTER'S DEGREE
0.3/ 100
METRIC RATING
277th/ 347
METRIC RANK
14.6%
MASTER'S DEGREE
34.2/ 100
METRIC RATING
191st/ 347
METRIC RANK
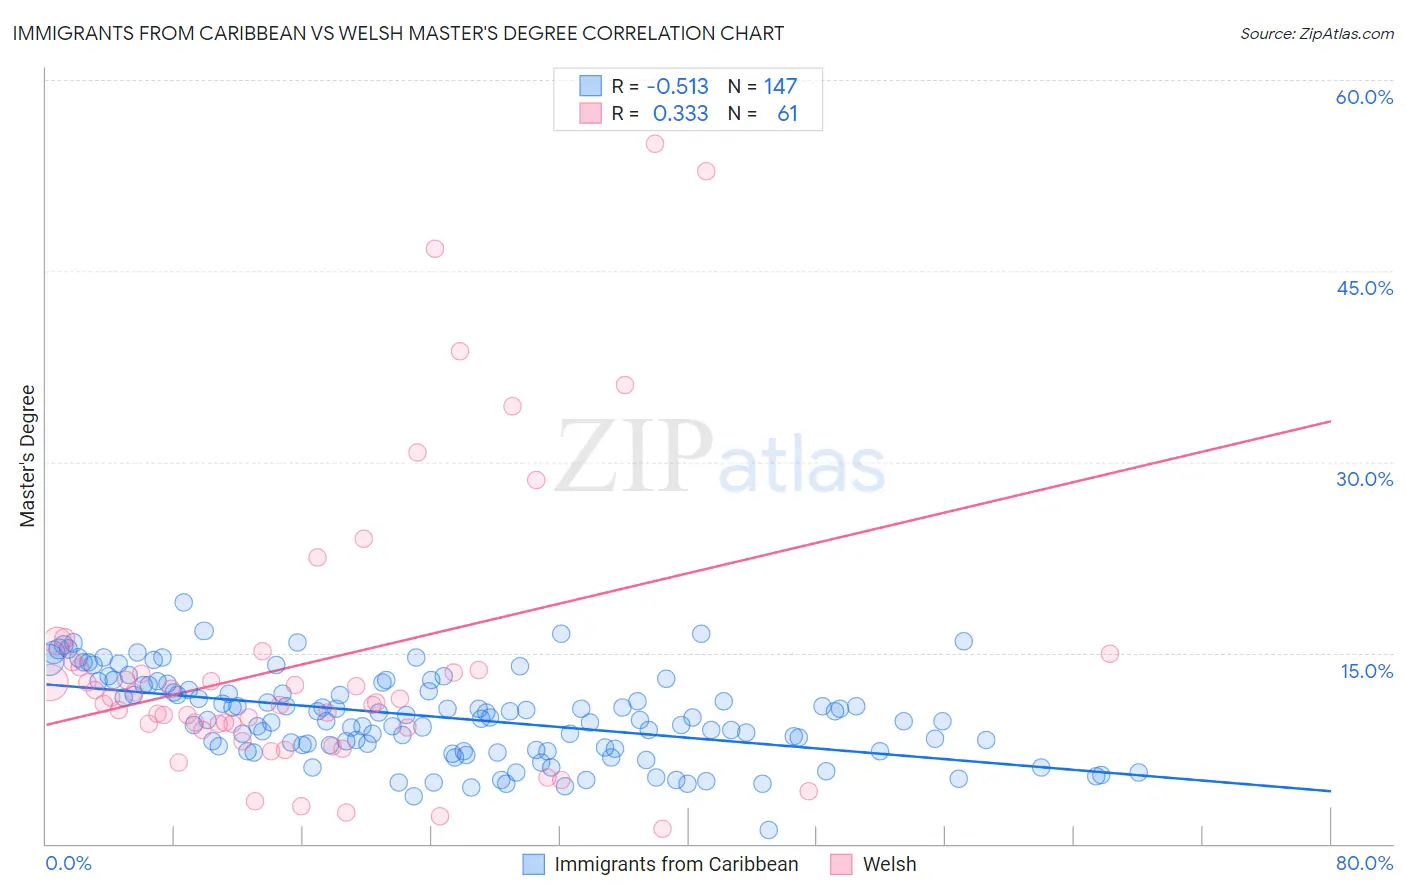
Immigrants from Caribbean vs Welsh Master's Degree Correlation Chart
The statistical analysis conducted on geographies consisting of 449,853,344 people shows a substantial negative correlation between the proportion of Immigrants from Caribbean and percentage of population with at least master's degree education in the United States with a correlation coefficient (R) of -0.513 and weighted average of 12.1%. Similarly, the statistical analysis conducted on geographies consisting of 528,158,256 people shows a mild positive correlation between the proportion of Welsh and percentage of population with at least master's degree education in the United States with a correlation coefficient (R) of 0.333 and weighted average of 14.6%, a difference of 21.1%.
Master's Degree Correlation Summary
| Measurement | Immigrants from Caribbean | Welsh |
| Minimum | 1.1% | 1.2% |
| Maximum | 18.9% | 55.0% |
| Range | 17.8% | 53.8% |
| Mean | 9.9% | 14.4% |
| Median | 9.7% | 11.1% |
| Interquartile 25% (IQ1) | 7.5% | 9.0% |
| Interquartile 75% (IQ3) | 12.4% | 14.1% |
| Interquartile Range (IQR) | 4.9% | 5.1% |
| Standard Deviation (Sample) | 3.3% | 11.5% |
| Standard Deviation (Population) | 3.3% | 11.4% |
Similar Demographics by Master's Degree
Demographics Similar to Immigrants from Caribbean by Master's Degree
In terms of master's degree, the demographic groups most similar to Immigrants from Caribbean are Potawatomi (12.1%, a difference of 0.0%), Black/African American (12.1%, a difference of 0.010%), Cuban (12.1%, a difference of 0.060%), Cape Verdean (12.1%, a difference of 0.080%), and Immigrants from Belize (12.1%, a difference of 0.080%).
| Demographics | Rating | Rank | Master's Degree |
| Salvadorans | 0.3 /100 | #270 | Tragic 12.2% |
| Haitians | 0.3 /100 | #271 | Tragic 12.1% |
| Comanche | 0.3 /100 | #272 | Tragic 12.1% |
| Blackfeet | 0.3 /100 | #273 | Tragic 12.1% |
| Cape Verdeans | 0.3 /100 | #274 | Tragic 12.1% |
| Cubans | 0.3 /100 | #275 | Tragic 12.1% |
| Blacks/African Americans | 0.3 /100 | #276 | Tragic 12.1% |
| Immigrants | Caribbean | 0.3 /100 | #277 | Tragic 12.1% |
| Potawatomi | 0.3 /100 | #278 | Tragic 12.1% |
| Immigrants | Belize | 0.2 /100 | #279 | Tragic 12.1% |
| Immigrants | Dominican Republic | 0.2 /100 | #280 | Tragic 12.1% |
| Malaysians | 0.2 /100 | #281 | Tragic 12.0% |
| Immigrants | El Salvador | 0.2 /100 | #282 | Tragic 12.0% |
| Hondurans | 0.2 /100 | #283 | Tragic 11.9% |
| Ottawa | 0.2 /100 | #284 | Tragic 11.9% |
Demographics Similar to Welsh by Master's Degree
In terms of master's degree, the demographic groups most similar to Welsh are Immigrants from Middle Africa (14.6%, a difference of 0.090%), Immigrants from Nigeria (14.6%, a difference of 0.22%), Spaniard (14.6%, a difference of 0.23%), Immigrants (14.6%, a difference of 0.25%), and Chinese (14.6%, a difference of 0.26%).
| Demographics | Rating | Rank | Master's Degree |
| Immigrants | Zaire | 39.5 /100 | #184 | Fair 14.7% |
| Barbadians | 38.3 /100 | #185 | Fair 14.7% |
| Immigrants | Oceania | 37.1 /100 | #186 | Fair 14.7% |
| Basques | 36.5 /100 | #187 | Fair 14.7% |
| Immigrants | Costa Rica | 36.2 /100 | #188 | Fair 14.7% |
| Immigrants | Immigrants | 36.0 /100 | #189 | Fair 14.6% |
| Spaniards | 35.8 /100 | #190 | Fair 14.6% |
| Welsh | 34.2 /100 | #191 | Fair 14.6% |
| Immigrants | Middle Africa | 33.6 /100 | #192 | Fair 14.6% |
| Immigrants | Nigeria | 32.7 /100 | #193 | Fair 14.6% |
| Chinese | 32.5 /100 | #194 | Fair 14.6% |
| Danes | 31.3 /100 | #195 | Fair 14.5% |
| Czechoslovakians | 29.9 /100 | #196 | Fair 14.5% |
| Belgians | 28.0 /100 | #197 | Fair 14.5% |
| West Indians | 27.4 /100 | #198 | Fair 14.5% |