Pima vs German Russian Doctorate Degree
COMPARE
Pima
German Russian
Doctorate Degree
Doctorate Degree Comparison
Pima
German Russians
1.3%
DOCTORATE DEGREE
0.0/ 100
METRIC RATING
325th/ 347
METRIC RANK
1.8%
DOCTORATE DEGREE
27.1/ 100
METRIC RATING
193rd/ 347
METRIC RANK
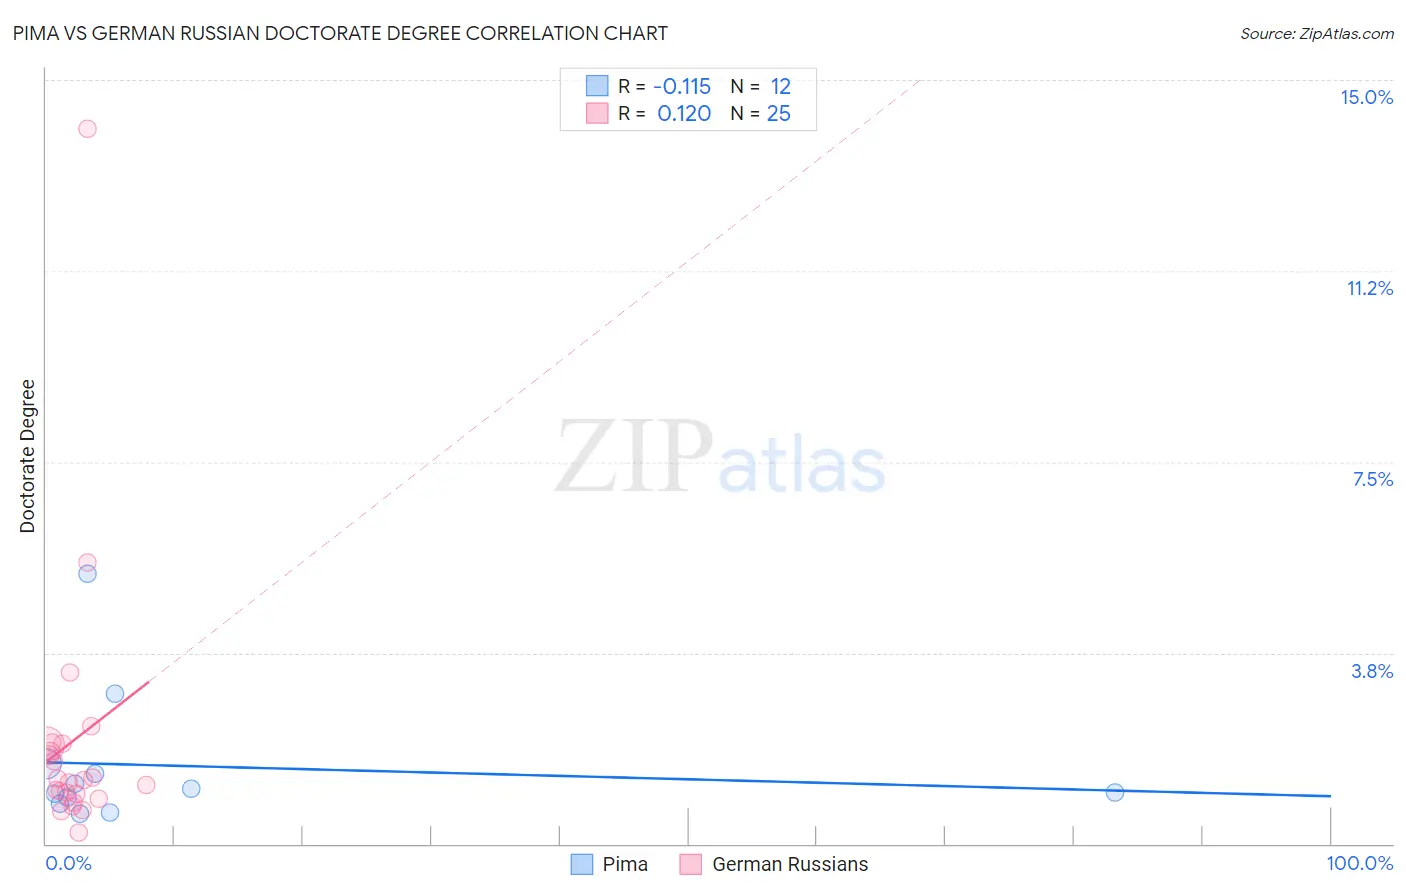
Pima vs German Russian Doctorate Degree Correlation Chart
The statistical analysis conducted on geographies consisting of 61,222,520 people shows a poor negative correlation between the proportion of Pima and percentage of population with at least doctorate degree education in the United States with a correlation coefficient (R) of -0.115 and weighted average of 1.3%. Similarly, the statistical analysis conducted on geographies consisting of 96,106,122 people shows a poor positive correlation between the proportion of German Russians and percentage of population with at least doctorate degree education in the United States with a correlation coefficient (R) of 0.120 and weighted average of 1.8%, a difference of 34.4%.
Doctorate Degree Correlation Summary
| Measurement | Pima | German Russian |
| Minimum | 0.59% | 0.22% |
| Maximum | 5.3% | 14.0% |
| Range | 4.7% | 13.8% |
| Mean | 1.5% | 2.0% |
| Median | 1.0% | 1.3% |
| Interquartile 25% (IQ1) | 0.85% | 0.92% |
| Interquartile 75% (IQ3) | 1.5% | 1.9% |
| Interquartile Range (IQR) | 0.64% | 1.0% |
| Standard Deviation (Sample) | 1.3% | 2.7% |
| Standard Deviation (Population) | 1.3% | 2.7% |
Similar Demographics by Doctorate Degree
Demographics Similar to Pima by Doctorate Degree
In terms of doctorate degree, the demographic groups most similar to Pima are Immigrants from Cabo Verde (1.3%, a difference of 0.020%), Hispanic or Latino (1.3%, a difference of 0.31%), Native/Alaskan (1.3%, a difference of 0.39%), Immigrants from Belize (1.3%, a difference of 0.72%), and Inupiat (1.3%, a difference of 0.89%).
| Demographics | Rating | Rank | Doctorate Degree |
| Creek | 0.1 /100 | #318 | Tragic 1.3% |
| Immigrants | Guyana | 0.1 /100 | #319 | Tragic 1.3% |
| Immigrants | St. Vincent and the Grenadines | 0.1 /100 | #320 | Tragic 1.3% |
| Dutch West Indians | 0.1 /100 | #321 | Tragic 1.3% |
| Seminole | 0.1 /100 | #322 | Tragic 1.3% |
| Immigrants | Belize | 0.1 /100 | #323 | Tragic 1.3% |
| Natives/Alaskans | 0.0 /100 | #324 | Tragic 1.3% |
| Pima | 0.0 /100 | #325 | Tragic 1.3% |
| Immigrants | Cabo Verde | 0.0 /100 | #326 | Tragic 1.3% |
| Hispanics or Latinos | 0.0 /100 | #327 | Tragic 1.3% |
| Inupiat | 0.0 /100 | #328 | Tragic 1.3% |
| Haitians | 0.0 /100 | #329 | Tragic 1.3% |
| Yup'ik | 0.0 /100 | #330 | Tragic 1.3% |
| Immigrants | Latin America | 0.0 /100 | #331 | Tragic 1.3% |
| Yakama | 0.0 /100 | #332 | Tragic 1.3% |
Demographics Similar to German Russians by Doctorate Degree
In terms of doctorate degree, the demographic groups most similar to German Russians are Dutch (1.8%, a difference of 0.070%), Uruguayan (1.8%, a difference of 0.17%), Immigrants from Somalia (1.8%, a difference of 0.33%), Subsaharan African (1.8%, a difference of 0.40%), and Chinese (1.8%, a difference of 0.40%).
| Demographics | Rating | Rank | Doctorate Degree |
| Peruvians | 34.4 /100 | #186 | Fair 1.8% |
| Czechoslovakians | 33.0 /100 | #187 | Fair 1.8% |
| Germans | 30.5 /100 | #188 | Fair 1.8% |
| French Canadians | 30.2 /100 | #189 | Fair 1.8% |
| Immigrants | Costa Rica | 30.2 /100 | #190 | Fair 1.8% |
| South Americans | 29.5 /100 | #191 | Fair 1.8% |
| Dutch | 27.4 /100 | #192 | Fair 1.8% |
| German Russians | 27.1 /100 | #193 | Fair 1.8% |
| Uruguayans | 26.2 /100 | #194 | Fair 1.8% |
| Immigrants | Somalia | 25.4 /100 | #195 | Fair 1.8% |
| Sub-Saharan Africans | 25.1 /100 | #196 | Fair 1.8% |
| Chinese | 25.1 /100 | #197 | Fair 1.8% |
| Immigrants | Ghana | 24.6 /100 | #198 | Fair 1.8% |
| Immigrants | South America | 23.3 /100 | #199 | Fair 1.8% |
| Whites/Caucasians | 22.8 /100 | #200 | Fair 1.8% |