Immigrants from Cabo Verde vs Israeli Master's Degree
COMPARE
Immigrants from Cabo Verde
Israeli
Master's Degree
Master's Degree Comparison
Immigrants from Cabo Verde
Israelis
11.3%
MASTER'S DEGREE
0.1/ 100
METRIC RATING
304th/ 347
METRIC RANK
20.3%
MASTER'S DEGREE
100.0/ 100
METRIC RATING
22nd/ 347
METRIC RANK
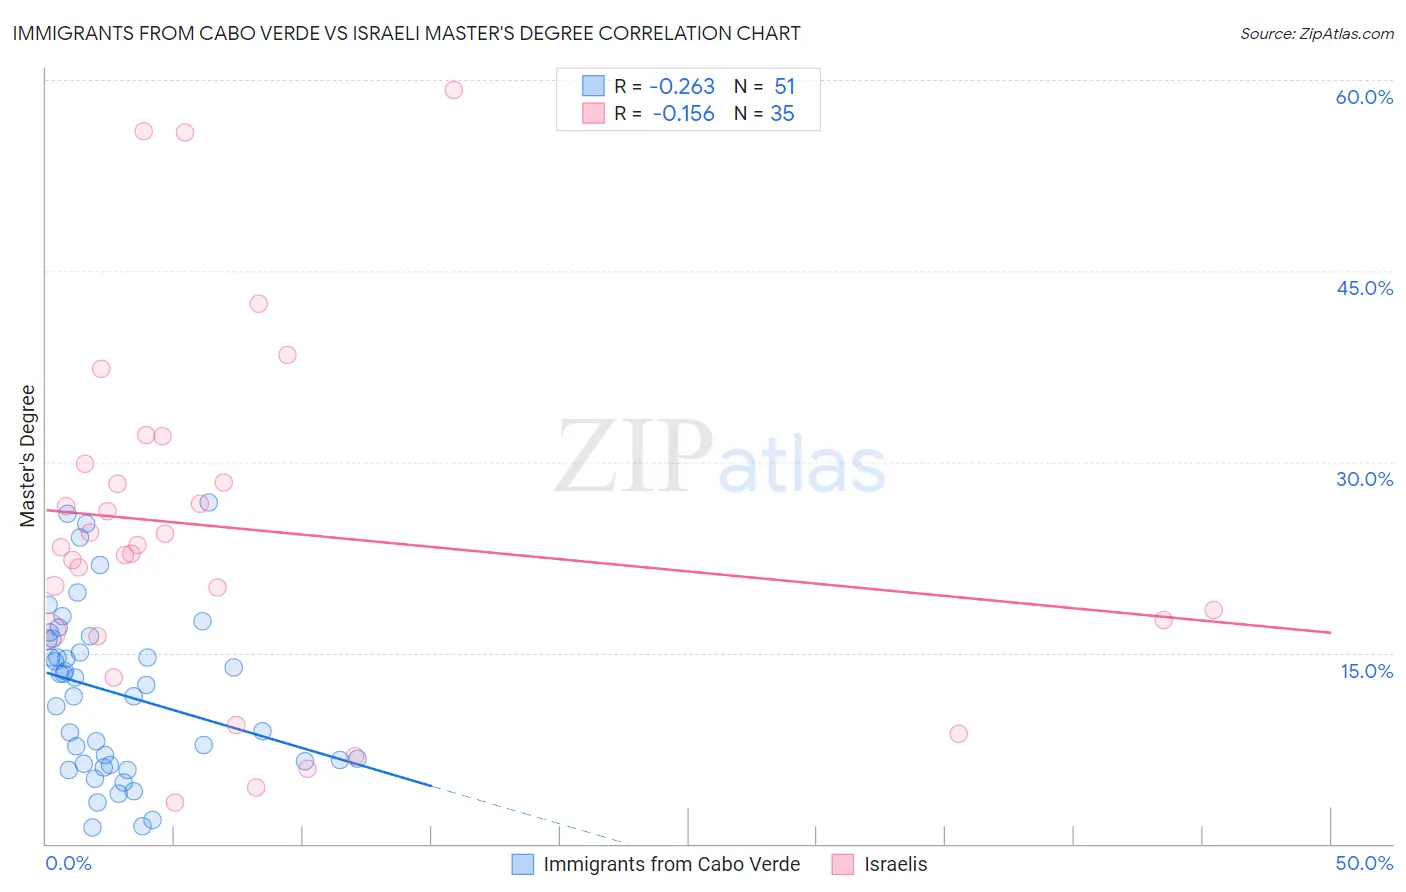
Immigrants from Cabo Verde vs Israeli Master's Degree Correlation Chart
The statistical analysis conducted on geographies consisting of 38,158,316 people shows a weak negative correlation between the proportion of Immigrants from Cabo Verde and percentage of population with at least master's degree education in the United States with a correlation coefficient (R) of -0.263 and weighted average of 11.3%. Similarly, the statistical analysis conducted on geographies consisting of 211,131,712 people shows a poor negative correlation between the proportion of Israelis and percentage of population with at least master's degree education in the United States with a correlation coefficient (R) of -0.156 and weighted average of 20.3%, a difference of 79.4%.
Master's Degree Correlation Summary
| Measurement | Immigrants from Cabo Verde | Israeli |
| Minimum | 1.2% | 3.2% |
| Maximum | 26.8% | 59.3% |
| Range | 25.5% | 56.0% |
| Mean | 11.9% | 24.7% |
| Median | 12.5% | 23.3% |
| Interquartile 25% (IQ1) | 6.3% | 16.7% |
| Interquartile 75% (IQ3) | 16.1% | 29.9% |
| Interquartile Range (IQR) | 9.8% | 13.2% |
| Standard Deviation (Sample) | 6.6% | 13.8% |
| Standard Deviation (Population) | 6.5% | 13.6% |
Similar Demographics by Master's Degree
Demographics Similar to Immigrants from Cabo Verde by Master's Degree
In terms of master's degree, the demographic groups most similar to Immigrants from Cabo Verde are Immigrants from Laos (11.4%, a difference of 0.19%), Cherokee (11.4%, a difference of 0.21%), Tsimshian (11.4%, a difference of 0.52%), Immigrants from Latin America (11.3%, a difference of 0.65%), and Chippewa (11.4%, a difference of 0.68%).
| Demographics | Rating | Rank | Master's Degree |
| Immigrants | Yemen | 0.1 /100 | #297 | Tragic 11.6% |
| Samoans | 0.1 /100 | #298 | Tragic 11.5% |
| Chickasaw | 0.1 /100 | #299 | Tragic 11.4% |
| Chippewa | 0.1 /100 | #300 | Tragic 11.4% |
| Tsimshian | 0.1 /100 | #301 | Tragic 11.4% |
| Cherokee | 0.1 /100 | #302 | Tragic 11.4% |
| Immigrants | Laos | 0.1 /100 | #303 | Tragic 11.4% |
| Immigrants | Cabo Verde | 0.1 /100 | #304 | Tragic 11.3% |
| Immigrants | Latin America | 0.0 /100 | #305 | Tragic 11.3% |
| Mexican American Indians | 0.0 /100 | #306 | Tragic 11.2% |
| Cheyenne | 0.0 /100 | #307 | Tragic 11.2% |
| Puerto Ricans | 0.0 /100 | #308 | Tragic 11.2% |
| Puget Sound Salish | 0.0 /100 | #309 | Tragic 11.1% |
| Shoshone | 0.0 /100 | #310 | Tragic 11.1% |
| Seminole | 0.0 /100 | #311 | Tragic 11.0% |
Demographics Similar to Israelis by Master's Degree
In terms of master's degree, the demographic groups most similar to Israelis are Immigrants from France (20.3%, a difference of 0.28%), Immigrants from Sweden (20.3%, a difference of 0.35%), Immigrants from Ireland (20.4%, a difference of 0.42%), Indian (Asian) (20.5%, a difference of 0.53%), and Immigrants from Hong Kong (20.5%, a difference of 0.55%).
| Demographics | Rating | Rank | Master's Degree |
| Immigrants | Eastern Asia | 100.0 /100 | #15 | Exceptional 20.8% |
| Immigrants | Belgium | 100.0 /100 | #16 | Exceptional 20.8% |
| Immigrants | South Central Asia | 100.0 /100 | #17 | Exceptional 20.7% |
| Soviet Union | 100.0 /100 | #18 | Exceptional 20.5% |
| Immigrants | Hong Kong | 100.0 /100 | #19 | Exceptional 20.5% |
| Indians (Asian) | 100.0 /100 | #20 | Exceptional 20.5% |
| Immigrants | Ireland | 100.0 /100 | #21 | Exceptional 20.4% |
| Israelis | 100.0 /100 | #22 | Exceptional 20.3% |
| Immigrants | France | 100.0 /100 | #23 | Exceptional 20.3% |
| Immigrants | Sweden | 100.0 /100 | #24 | Exceptional 20.3% |
| Immigrants | Japan | 100.0 /100 | #25 | Exceptional 20.0% |
| Cambodians | 100.0 /100 | #26 | Exceptional 20.0% |
| Immigrants | Sri Lanka | 100.0 /100 | #27 | Exceptional 19.9% |
| Turks | 100.0 /100 | #28 | Exceptional 19.9% |
| Latvians | 100.0 /100 | #29 | Exceptional 19.8% |