Immigrants from Cabo Verde vs Lebanese College, 1 year or more
COMPARE
Immigrants from Cabo Verde
Lebanese
College, 1 year or more
College, 1 year or more Comparison
Immigrants from Cabo Verde
Lebanese
48.1%
COLLEGE, 1 YEAR OR MORE
0.0/ 100
METRIC RATING
340th/ 347
METRIC RANK
61.6%
COLLEGE, 1 YEAR OR MORE
94.1/ 100
METRIC RATING
116th/ 347
METRIC RANK
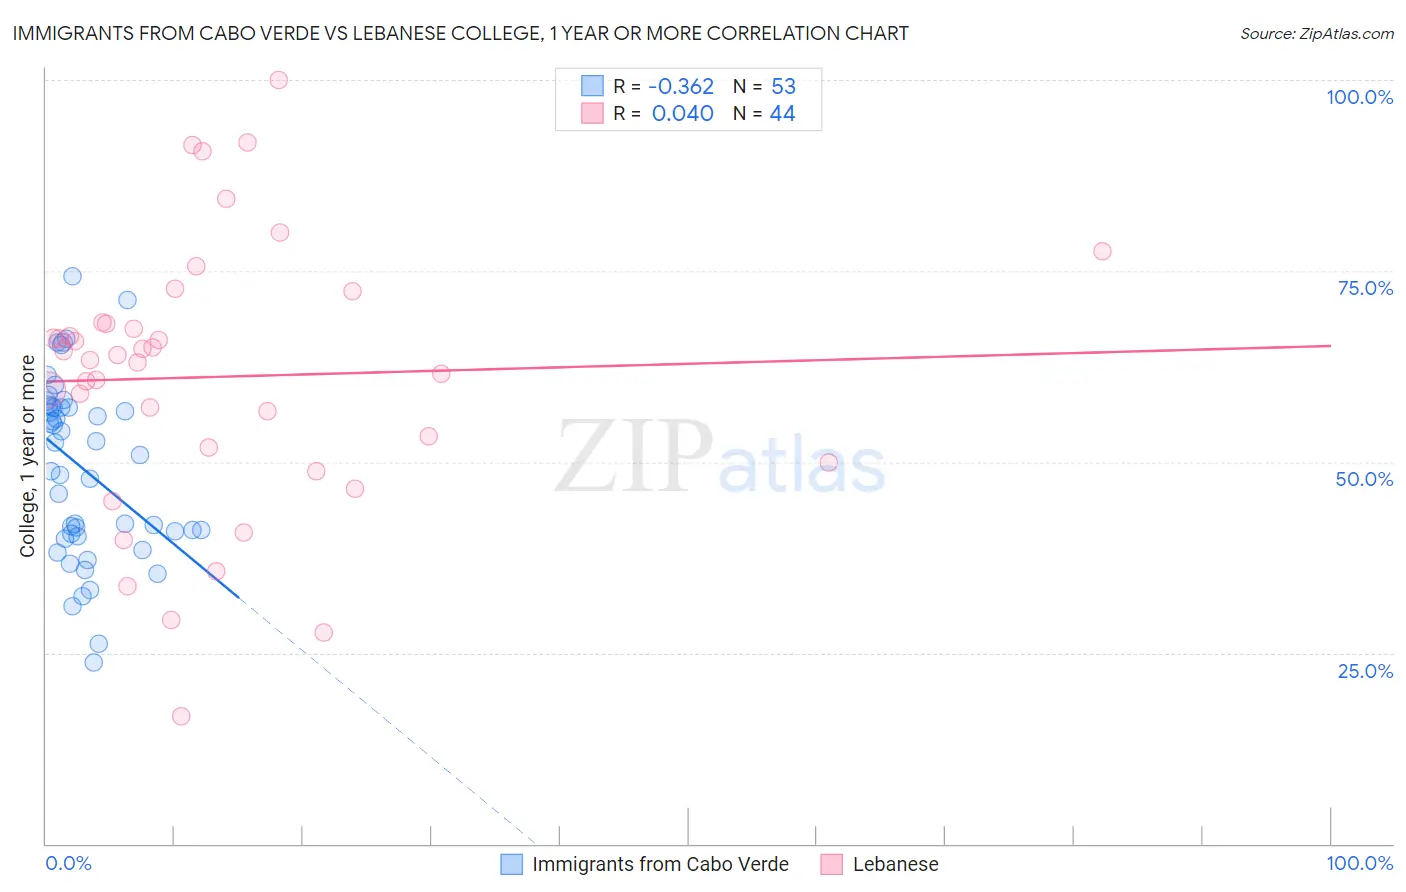
Immigrants from Cabo Verde vs Lebanese College, 1 year or more Correlation Chart
The statistical analysis conducted on geographies consisting of 38,158,666 people shows a mild negative correlation between the proportion of Immigrants from Cabo Verde and percentage of population with at least college, 1 year or more education in the United States with a correlation coefficient (R) of -0.362 and weighted average of 48.1%. Similarly, the statistical analysis conducted on geographies consisting of 401,622,274 people shows no correlation between the proportion of Lebanese and percentage of population with at least college, 1 year or more education in the United States with a correlation coefficient (R) of 0.040 and weighted average of 61.6%, a difference of 28.1%.
College, 1 year or more Correlation Summary
| Measurement | Immigrants from Cabo Verde | Lebanese |
| Minimum | 23.7% | 16.6% |
| Maximum | 74.3% | 100.0% |
| Range | 50.5% | 83.4% |
| Mean | 49.1% | 61.1% |
| Median | 51.0% | 63.7% |
| Interquartile 25% (IQ1) | 40.4% | 50.9% |
| Interquartile 75% (IQ3) | 57.2% | 68.2% |
| Interquartile Range (IQR) | 16.8% | 17.3% |
| Standard Deviation (Sample) | 11.7% | 17.8% |
| Standard Deviation (Population) | 11.6% | 17.6% |
Similar Demographics by College, 1 year or more
Demographics Similar to Immigrants from Cabo Verde by College, 1 year or more
In terms of college, 1 year or more, the demographic groups most similar to Immigrants from Cabo Verde are Immigrants from the Azores (48.4%, a difference of 0.57%), Immigrants from Central America (48.5%, a difference of 0.83%), Pennsylvania German (48.5%, a difference of 0.88%), Spanish American Indian (48.5%, a difference of 0.89%), and Immigrants from Mexico (47.5%, a difference of 1.2%).
| Demographics | Rating | Rank | College, 1 year or more |
| Immigrants | Dominican Republic | 0.0 /100 | #333 | Tragic 49.1% |
| Lumbee | 0.0 /100 | #334 | Tragic 48.9% |
| Yuman | 0.0 /100 | #335 | Tragic 48.7% |
| Spanish American Indians | 0.0 /100 | #336 | Tragic 48.5% |
| Pennsylvania Germans | 0.0 /100 | #337 | Tragic 48.5% |
| Immigrants | Central America | 0.0 /100 | #338 | Tragic 48.5% |
| Immigrants | Azores | 0.0 /100 | #339 | Tragic 48.4% |
| Immigrants | Cabo Verde | 0.0 /100 | #340 | Tragic 48.1% |
| Immigrants | Mexico | 0.0 /100 | #341 | Tragic 47.5% |
| Inupiat | 0.0 /100 | #342 | Tragic 47.2% |
| Tohono O'odham | 0.0 /100 | #343 | Tragic 47.1% |
| Yakama | 0.0 /100 | #344 | Tragic 46.2% |
| Pima | 0.0 /100 | #345 | Tragic 45.6% |
| Houma | 0.0 /100 | #346 | Tragic 41.2% |
| Yup'ik | 0.0 /100 | #347 | Tragic 39.4% |
Demographics Similar to Lebanese by College, 1 year or more
In terms of college, 1 year or more, the demographic groups most similar to Lebanese are Arab (61.6%, a difference of 0.040%), Immigrants from Brazil (61.6%, a difference of 0.050%), Norwegian (61.7%, a difference of 0.10%), Danish (61.7%, a difference of 0.17%), and Assyrian/Chaldean/Syriac (61.5%, a difference of 0.18%).
| Demographics | Rating | Rank | College, 1 year or more |
| Immigrants | Northern Africa | 95.7 /100 | #109 | Exceptional 61.9% |
| Europeans | 95.6 /100 | #110 | Exceptional 61.8% |
| Macedonians | 95.6 /100 | #111 | Exceptional 61.8% |
| Austrians | 95.4 /100 | #112 | Exceptional 61.8% |
| Ukrainians | 95.2 /100 | #113 | Exceptional 61.8% |
| Danes | 94.8 /100 | #114 | Exceptional 61.7% |
| Norwegians | 94.5 /100 | #115 | Exceptional 61.7% |
| Lebanese | 94.1 /100 | #116 | Exceptional 61.6% |
| Arabs | 93.9 /100 | #117 | Exceptional 61.6% |
| Immigrants | Brazil | 93.9 /100 | #118 | Exceptional 61.6% |
| Assyrians/Chaldeans/Syriacs | 93.3 /100 | #119 | Exceptional 61.5% |
| Pakistanis | 93.2 /100 | #120 | Exceptional 61.5% |
| Immigrants | Jordan | 92.7 /100 | #121 | Exceptional 61.4% |
| Immigrants | Chile | 92.3 /100 | #122 | Exceptional 61.4% |
| Serbians | 92.2 /100 | #123 | Exceptional 61.4% |