Immigrants from Iraq vs Haitian Bachelor's Degree
COMPARE
Immigrants from Iraq
Haitian
Bachelor's Degree
Bachelor's Degree Comparison
Immigrants from Iraq
Haitians
37.9%
BACHELOR'S DEGREE
52.5/ 100
METRIC RATING
173rd/ 347
METRIC RANK
31.3%
BACHELOR'S DEGREE
0.1/ 100
METRIC RATING
284th/ 347
METRIC RANK
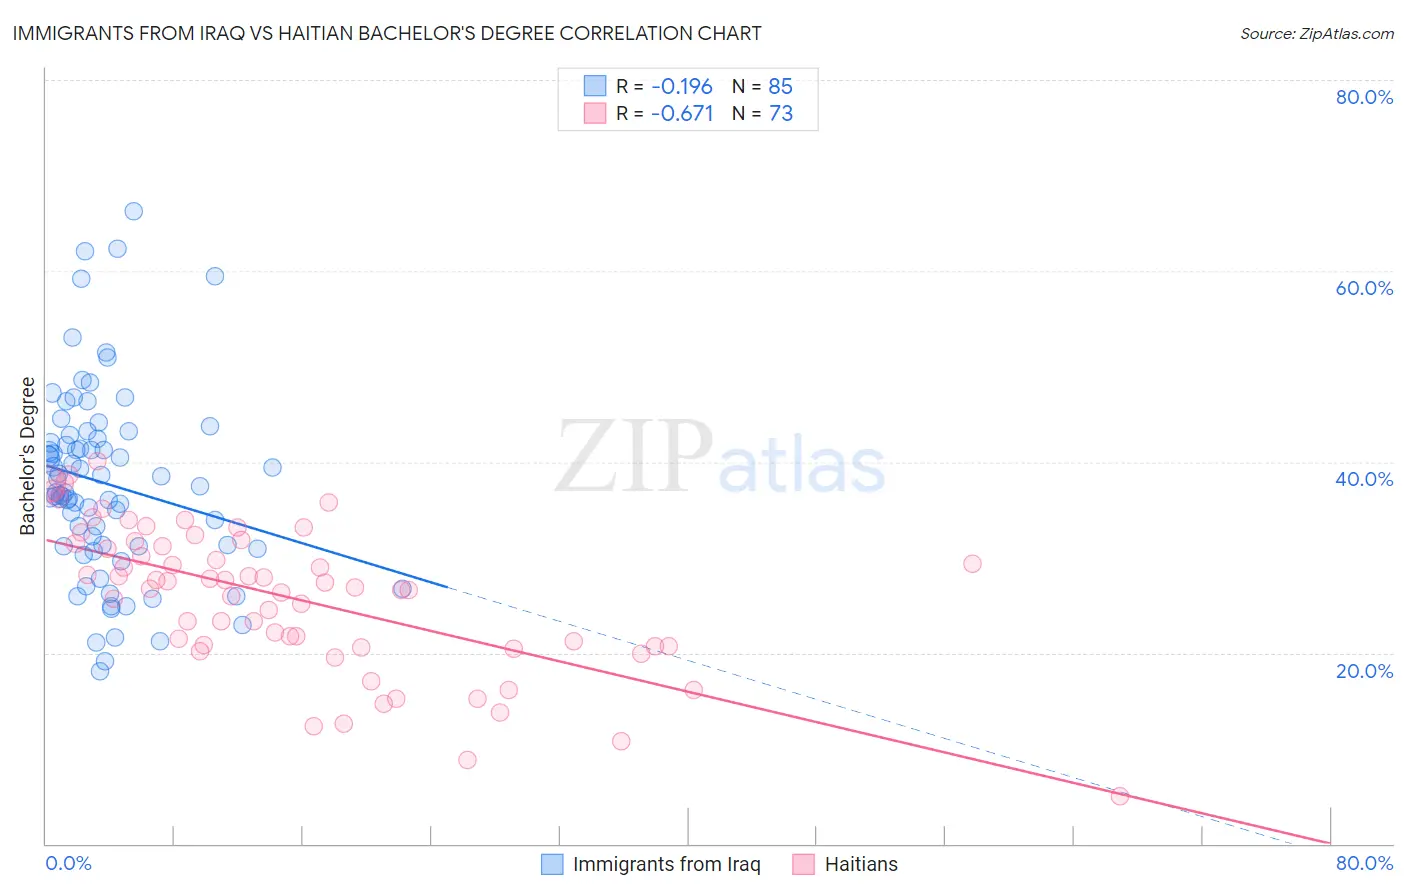
Immigrants from Iraq vs Haitian Bachelor's Degree Correlation Chart
The statistical analysis conducted on geographies consisting of 194,775,437 people shows a poor negative correlation between the proportion of Immigrants from Iraq and percentage of population with at least bachelor's degree education in the United States with a correlation coefficient (R) of -0.196 and weighted average of 37.9%. Similarly, the statistical analysis conducted on geographies consisting of 287,970,705 people shows a significant negative correlation between the proportion of Haitians and percentage of population with at least bachelor's degree education in the United States with a correlation coefficient (R) of -0.671 and weighted average of 31.3%, a difference of 21.0%.
Bachelor's Degree Correlation Summary
| Measurement | Immigrants from Iraq | Haitian |
| Minimum | 18.0% | 4.9% |
| Maximum | 66.3% | 40.1% |
| Range | 48.3% | 35.1% |
| Mean | 37.7% | 25.8% |
| Median | 36.8% | 26.9% |
| Interquartile 25% (IQ1) | 31.2% | 20.7% |
| Interquartile 75% (IQ3) | 42.7% | 31.6% |
| Interquartile Range (IQR) | 11.5% | 10.8% |
| Standard Deviation (Sample) | 9.9% | 7.6% |
| Standard Deviation (Population) | 9.8% | 7.6% |
Similar Demographics by Bachelor's Degree
Demographics Similar to Immigrants from Iraq by Bachelor's Degree
In terms of bachelor's degree, the demographic groups most similar to Immigrants from Iraq are Immigrants from Somalia (37.9%, a difference of 0.020%), Bermudan (38.0%, a difference of 0.16%), Czech (38.0%, a difference of 0.18%), Immigrants from Bangladesh (37.8%, a difference of 0.25%), and Ghanaian (38.0%, a difference of 0.27%).
| Demographics | Rating | Rank | Bachelor's Degree |
| Somalis | 58.6 /100 | #166 | Average 38.1% |
| Scottish | 56.6 /100 | #167 | Average 38.1% |
| Danes | 56.2 /100 | #168 | Average 38.1% |
| Ghanaians | 55.3 /100 | #169 | Average 38.0% |
| Czechs | 54.4 /100 | #170 | Average 38.0% |
| Bermudans | 54.2 /100 | #171 | Average 38.0% |
| Immigrants | Somalia | 52.8 /100 | #172 | Average 37.9% |
| Immigrants | Iraq | 52.5 /100 | #173 | Average 37.9% |
| Immigrants | Bangladesh | 50.0 /100 | #174 | Average 37.8% |
| Immigrants | Uruguay | 48.3 /100 | #175 | Average 37.8% |
| Costa Ricans | 47.6 /100 | #176 | Average 37.7% |
| Basques | 47.4 /100 | #177 | Average 37.7% |
| Immigrants | Cameroon | 46.8 /100 | #178 | Average 37.7% |
| Immigrants | Colombia | 45.4 /100 | #179 | Average 37.7% |
| Irish | 44.3 /100 | #180 | Average 37.6% |
Demographics Similar to Haitians by Bachelor's Degree
In terms of bachelor's degree, the demographic groups most similar to Haitians are Aleut (31.3%, a difference of 0.010%), Honduran (31.3%, a difference of 0.030%), Immigrants from El Salvador (31.3%, a difference of 0.070%), Immigrants from Caribbean (31.4%, a difference of 0.31%), and Blackfeet (31.5%, a difference of 0.45%).
| Demographics | Rating | Rank | Bachelor's Degree |
| Dominicans | 0.1 /100 | #277 | Tragic 31.8% |
| Marshallese | 0.1 /100 | #278 | Tragic 31.7% |
| Hawaiians | 0.1 /100 | #279 | Tragic 31.6% |
| Immigrants | Laos | 0.1 /100 | #280 | Tragic 31.6% |
| Blackfeet | 0.1 /100 | #281 | Tragic 31.5% |
| Immigrants | Caribbean | 0.1 /100 | #282 | Tragic 31.4% |
| Hondurans | 0.1 /100 | #283 | Tragic 31.3% |
| Haitians | 0.1 /100 | #284 | Tragic 31.3% |
| Aleuts | 0.1 /100 | #285 | Tragic 31.3% |
| Immigrants | El Salvador | 0.1 /100 | #286 | Tragic 31.3% |
| Ottawa | 0.1 /100 | #287 | Tragic 31.1% |
| Guatemalans | 0.1 /100 | #288 | Tragic 31.0% |
| Puerto Ricans | 0.1 /100 | #289 | Tragic 31.0% |
| Immigrants | Honduras | 0.1 /100 | #290 | Tragic 30.9% |
| Blacks/African Americans | 0.1 /100 | #291 | Tragic 30.9% |