Immigrants from South Central Asia vs Paiute Nursery School
COMPARE
Immigrants from South Central Asia
Paiute
Nursery School
Nursery School Comparison
Immigrants from South Central Asia
Paiute
98.0%
NURSERY SCHOOL
66.7/ 100
METRIC RATING
155th/ 347
METRIC RANK
98.0%
NURSERY SCHOOL
42.0/ 100
METRIC RATING
182nd/ 347
METRIC RANK
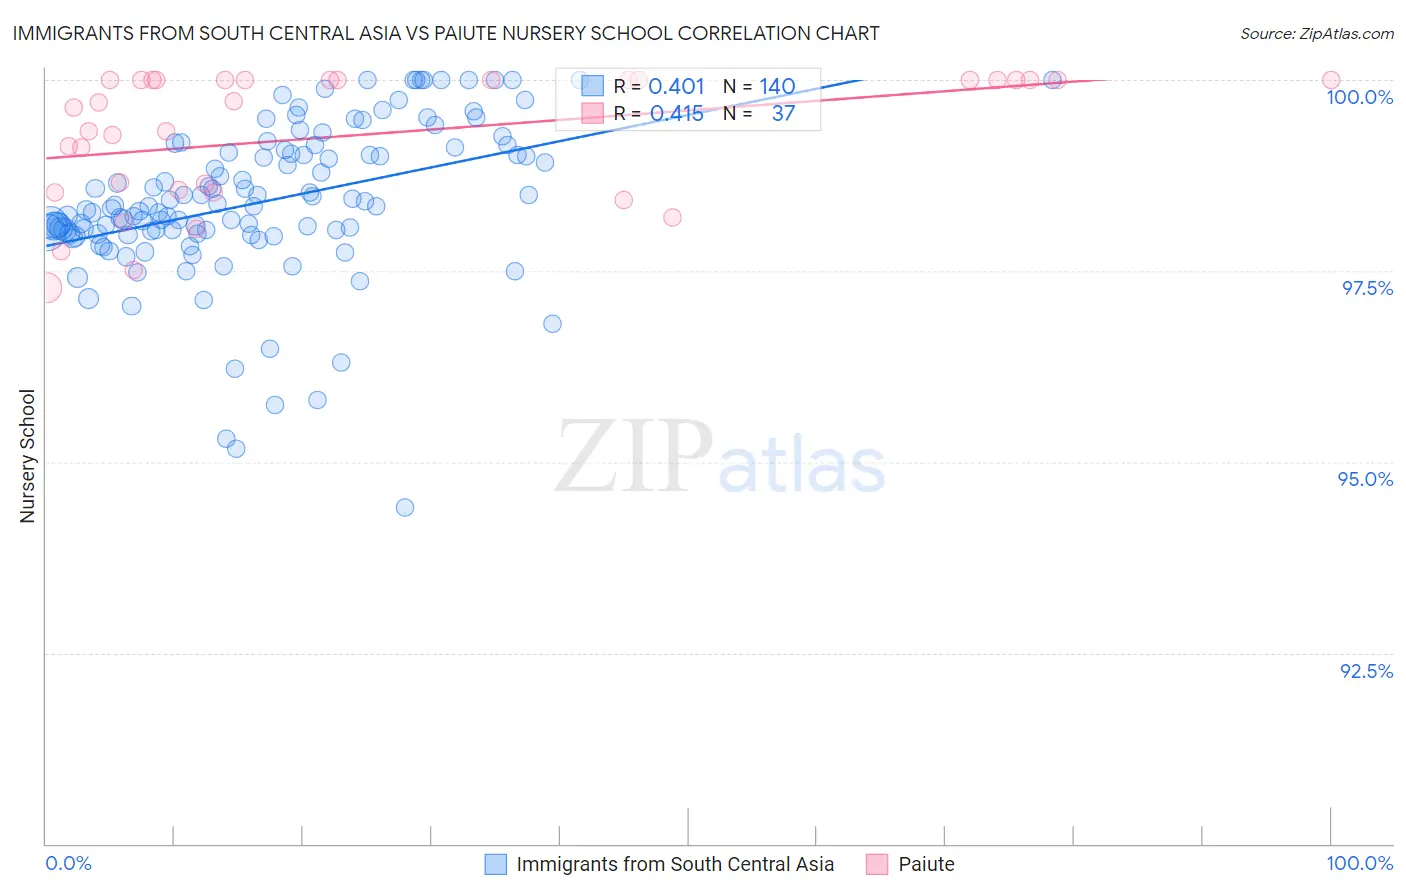
Immigrants from South Central Asia vs Paiute Nursery School Correlation Chart
The statistical analysis conducted on geographies consisting of 473,113,181 people shows a moderate positive correlation between the proportion of Immigrants from South Central Asia and percentage of population with at least nursery school education in the United States with a correlation coefficient (R) of 0.401 and weighted average of 98.0%. Similarly, the statistical analysis conducted on geographies consisting of 58,402,332 people shows a moderate positive correlation between the proportion of Paiute and percentage of population with at least nursery school education in the United States with a correlation coefficient (R) of 0.415 and weighted average of 98.0%, a difference of 0.080%.
Nursery School Correlation Summary
| Measurement | Immigrants from South Central Asia | Paiute |
| Minimum | 94.4% | 97.3% |
| Maximum | 100.0% | 100.0% |
| Range | 5.6% | 2.7% |
| Mean | 98.4% | 99.3% |
| Median | 98.3% | 99.7% |
| Interquartile 25% (IQ1) | 98.0% | 98.5% |
| Interquartile 75% (IQ3) | 99.1% | 100.0% |
| Interquartile Range (IQR) | 1.1% | 1.5% |
| Standard Deviation (Sample) | 1.0% | 0.85% |
| Standard Deviation (Population) | 1.0% | 0.84% |
Similar Demographics by Nursery School
Demographics Similar to Immigrants from South Central Asia by Nursery School
In terms of nursery school, the demographic groups most similar to Immigrants from South Central Asia are Venezuelan (98.0%, a difference of 0.0%), Comanche (98.0%, a difference of 0.0%), Immigrants from North Macedonia (98.0%, a difference of 0.0%), Dutch West Indian (98.0%, a difference of 0.010%), and Immigrants from Moldova (98.0%, a difference of 0.010%).
| Demographics | Rating | Rank | Nursery School |
| Immigrants | Greece | 75.4 /100 | #148 | Good 98.1% |
| Apache | 73.2 /100 | #149 | Good 98.1% |
| Jordanians | 72.9 /100 | #150 | Good 98.1% |
| Soviet Union | 71.6 /100 | #151 | Good 98.0% |
| Dutch West Indians | 70.2 /100 | #152 | Good 98.0% |
| Immigrants | Moldova | 69.6 /100 | #153 | Good 98.0% |
| Immigrants | Iran | 68.7 /100 | #154 | Good 98.0% |
| Immigrants | South Central Asia | 66.7 /100 | #155 | Good 98.0% |
| Venezuelans | 66.6 /100 | #156 | Good 98.0% |
| Comanche | 66.0 /100 | #157 | Good 98.0% |
| Immigrants | North Macedonia | 65.7 /100 | #158 | Good 98.0% |
| French American Indians | 62.1 /100 | #159 | Good 98.0% |
| Immigrants | Russia | 59.9 /100 | #160 | Average 98.0% |
| Immigrants | Eastern Europe | 59.7 /100 | #161 | Average 98.0% |
| Brazilians | 59.4 /100 | #162 | Average 98.0% |
Demographics Similar to Paiute by Nursery School
In terms of nursery school, the demographic groups most similar to Paiute are Egyptian (98.0%, a difference of 0.0%), Portuguese (98.0%, a difference of 0.0%), Immigrants from Poland (98.0%, a difference of 0.0%), Immigrants from Belarus (98.0%, a difference of 0.0%), and Immigrants from Argentina (98.0%, a difference of 0.0%).
| Demographics | Rating | Rank | Nursery School |
| Immigrants | Sri Lanka | 49.9 /100 | #175 | Average 98.0% |
| Immigrants | Venezuela | 49.8 /100 | #176 | Average 98.0% |
| Albanians | 48.9 /100 | #177 | Average 98.0% |
| Natives/Alaskans | 48.6 /100 | #178 | Average 98.0% |
| Argentineans | 46.8 /100 | #179 | Average 98.0% |
| Immigrants | Bosnia and Herzegovina | 45.6 /100 | #180 | Average 98.0% |
| Egyptians | 42.8 /100 | #181 | Average 98.0% |
| Paiute | 42.0 /100 | #182 | Average 98.0% |
| Portuguese | 41.8 /100 | #183 | Average 98.0% |
| Immigrants | Poland | 41.3 /100 | #184 | Average 98.0% |
| Immigrants | Belarus | 41.0 /100 | #185 | Average 98.0% |
| Immigrants | Argentina | 40.8 /100 | #186 | Average 98.0% |
| Immigrants | Kazakhstan | 37.1 /100 | #187 | Fair 97.9% |
| Arabs | 34.7 /100 | #188 | Fair 97.9% |
| Pakistanis | 34.6 /100 | #189 | Fair 97.9% |