Immigrants from Albania vs Paiute Nursery School
COMPARE
Immigrants from Albania
Paiute
Nursery School
Nursery School Comparison
Immigrants from Albania
Paiute
97.9%
NURSERY SCHOOL
16.4/ 100
METRIC RATING
206th/ 347
METRIC RANK
98.0%
NURSERY SCHOOL
42.0/ 100
METRIC RATING
182nd/ 347
METRIC RANK
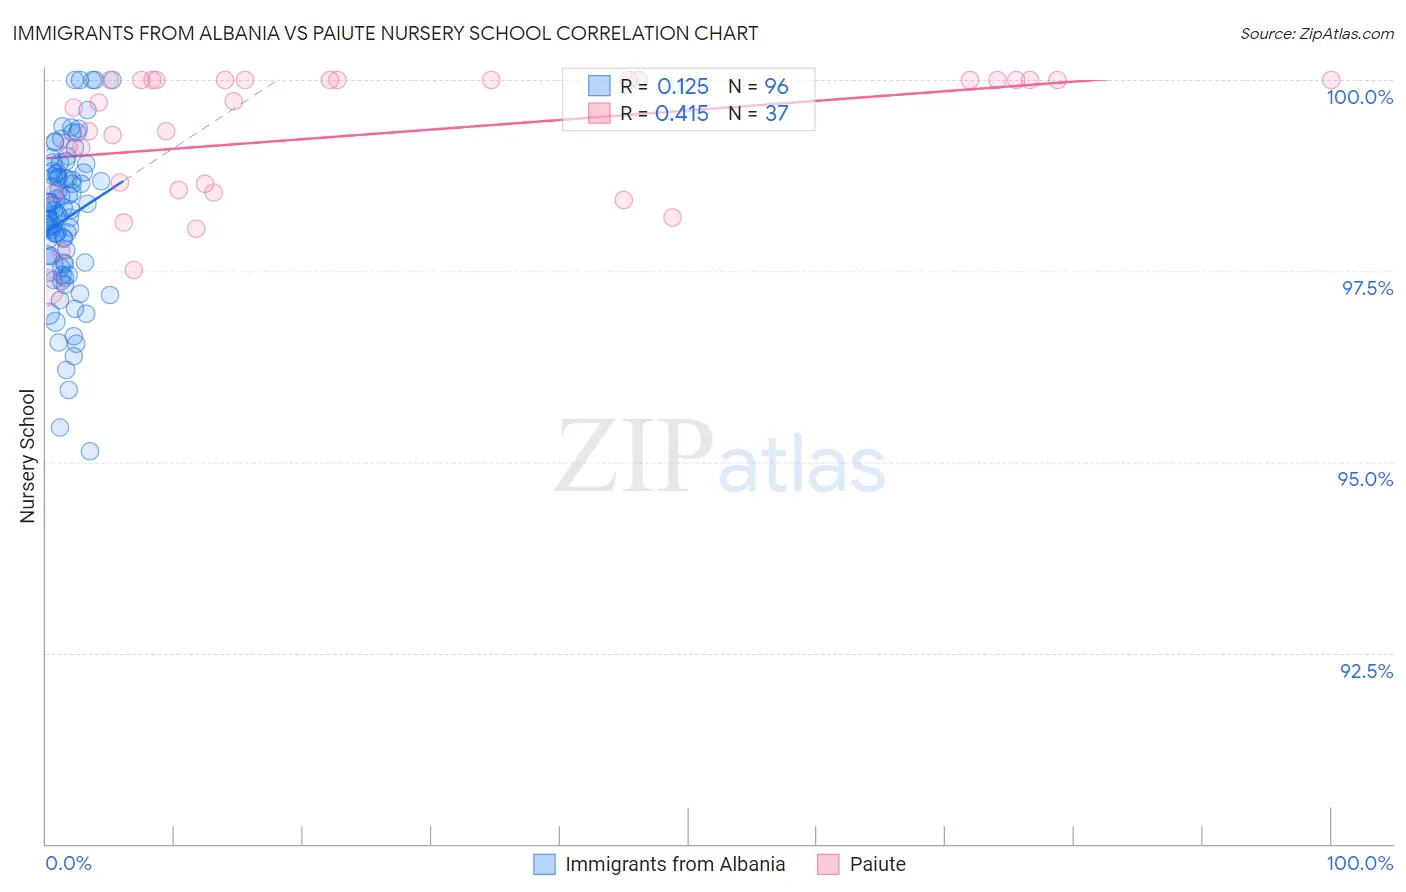
Immigrants from Albania vs Paiute Nursery School Correlation Chart
The statistical analysis conducted on geographies consisting of 119,263,578 people shows a poor positive correlation between the proportion of Immigrants from Albania and percentage of population with at least nursery school education in the United States with a correlation coefficient (R) of 0.125 and weighted average of 97.9%. Similarly, the statistical analysis conducted on geographies consisting of 58,402,332 people shows a moderate positive correlation between the proportion of Paiute and percentage of population with at least nursery school education in the United States with a correlation coefficient (R) of 0.415 and weighted average of 98.0%, a difference of 0.10%.
Nursery School Correlation Summary
| Measurement | Immigrants from Albania | Paiute |
| Minimum | 95.1% | 97.3% |
| Maximum | 100.0% | 100.0% |
| Range | 4.9% | 2.7% |
| Mean | 98.2% | 99.3% |
| Median | 98.3% | 99.7% |
| Interquartile 25% (IQ1) | 97.6% | 98.5% |
| Interquartile 75% (IQ3) | 98.8% | 100.0% |
| Interquartile Range (IQR) | 1.2% | 1.5% |
| Standard Deviation (Sample) | 0.97% | 0.85% |
| Standard Deviation (Population) | 0.97% | 0.84% |
Similar Demographics by Nursery School
Demographics Similar to Immigrants from Albania by Nursery School
In terms of nursery school, the demographic groups most similar to Immigrants from Albania are Immigrants from Chile (97.9%, a difference of 0.0%), Immigrants from Uganda (97.9%, a difference of 0.010%), Immigrants from Southern Europe (97.9%, a difference of 0.010%), African (97.9%, a difference of 0.010%), and Immigrants from Lebanon (97.9%, a difference of 0.020%).
| Demographics | Rating | Rank | Nursery School |
| Immigrants | Egypt | 22.5 /100 | #199 | Fair 97.9% |
| Tohono O'odham | 22.2 /100 | #200 | Fair 97.9% |
| Immigrants | Lebanon | 21.2 /100 | #201 | Fair 97.9% |
| Immigrants | Ukraine | 19.9 /100 | #202 | Poor 97.9% |
| Immigrants | Uganda | 18.0 /100 | #203 | Poor 97.9% |
| Immigrants | Southern Europe | 17.4 /100 | #204 | Poor 97.9% |
| Immigrants | Chile | 17.3 /100 | #205 | Poor 97.9% |
| Immigrants | Albania | 16.4 /100 | #206 | Poor 97.9% |
| Africans | 15.4 /100 | #207 | Poor 97.9% |
| Immigrants | Northern Africa | 11.7 /100 | #208 | Poor 97.8% |
| Costa Ricans | 11.3 /100 | #209 | Poor 97.8% |
| Immigrants | Oceania | 10.2 /100 | #210 | Poor 97.8% |
| Laotians | 9.8 /100 | #211 | Tragic 97.8% |
| Immigrants | Bahamas | 8.6 /100 | #212 | Tragic 97.8% |
| Moroccans | 8.3 /100 | #213 | Tragic 97.8% |
Demographics Similar to Paiute by Nursery School
In terms of nursery school, the demographic groups most similar to Paiute are Egyptian (98.0%, a difference of 0.0%), Portuguese (98.0%, a difference of 0.0%), Immigrants from Poland (98.0%, a difference of 0.0%), Immigrants from Belarus (98.0%, a difference of 0.0%), and Immigrants from Argentina (98.0%, a difference of 0.0%).
| Demographics | Rating | Rank | Nursery School |
| Immigrants | Sri Lanka | 49.9 /100 | #175 | Average 98.0% |
| Immigrants | Venezuela | 49.8 /100 | #176 | Average 98.0% |
| Albanians | 48.9 /100 | #177 | Average 98.0% |
| Natives/Alaskans | 48.6 /100 | #178 | Average 98.0% |
| Argentineans | 46.8 /100 | #179 | Average 98.0% |
| Immigrants | Bosnia and Herzegovina | 45.6 /100 | #180 | Average 98.0% |
| Egyptians | 42.8 /100 | #181 | Average 98.0% |
| Paiute | 42.0 /100 | #182 | Average 98.0% |
| Portuguese | 41.8 /100 | #183 | Average 98.0% |
| Immigrants | Poland | 41.3 /100 | #184 | Average 98.0% |
| Immigrants | Belarus | 41.0 /100 | #185 | Average 98.0% |
| Immigrants | Argentina | 40.8 /100 | #186 | Average 98.0% |
| Immigrants | Kazakhstan | 37.1 /100 | #187 | Fair 97.9% |
| Arabs | 34.7 /100 | #188 | Fair 97.9% |
| Pakistanis | 34.6 /100 | #189 | Fair 97.9% |