Immigrants from Sudan vs Immigrants from Singapore 12th Grade, No Diploma
COMPARE
Immigrants from Sudan
Immigrants from Singapore
12th Grade, No Diploma
12th Grade, No Diploma Comparison
Immigrants from Sudan
Immigrants from Singapore
90.8%
12TH GRADE, NO DIPLOMA
22.6/ 100
METRIC RATING
197th/ 347
METRIC RANK
93.3%
12TH GRADE, NO DIPLOMA
99.9/ 100
METRIC RATING
18th/ 347
METRIC RANK
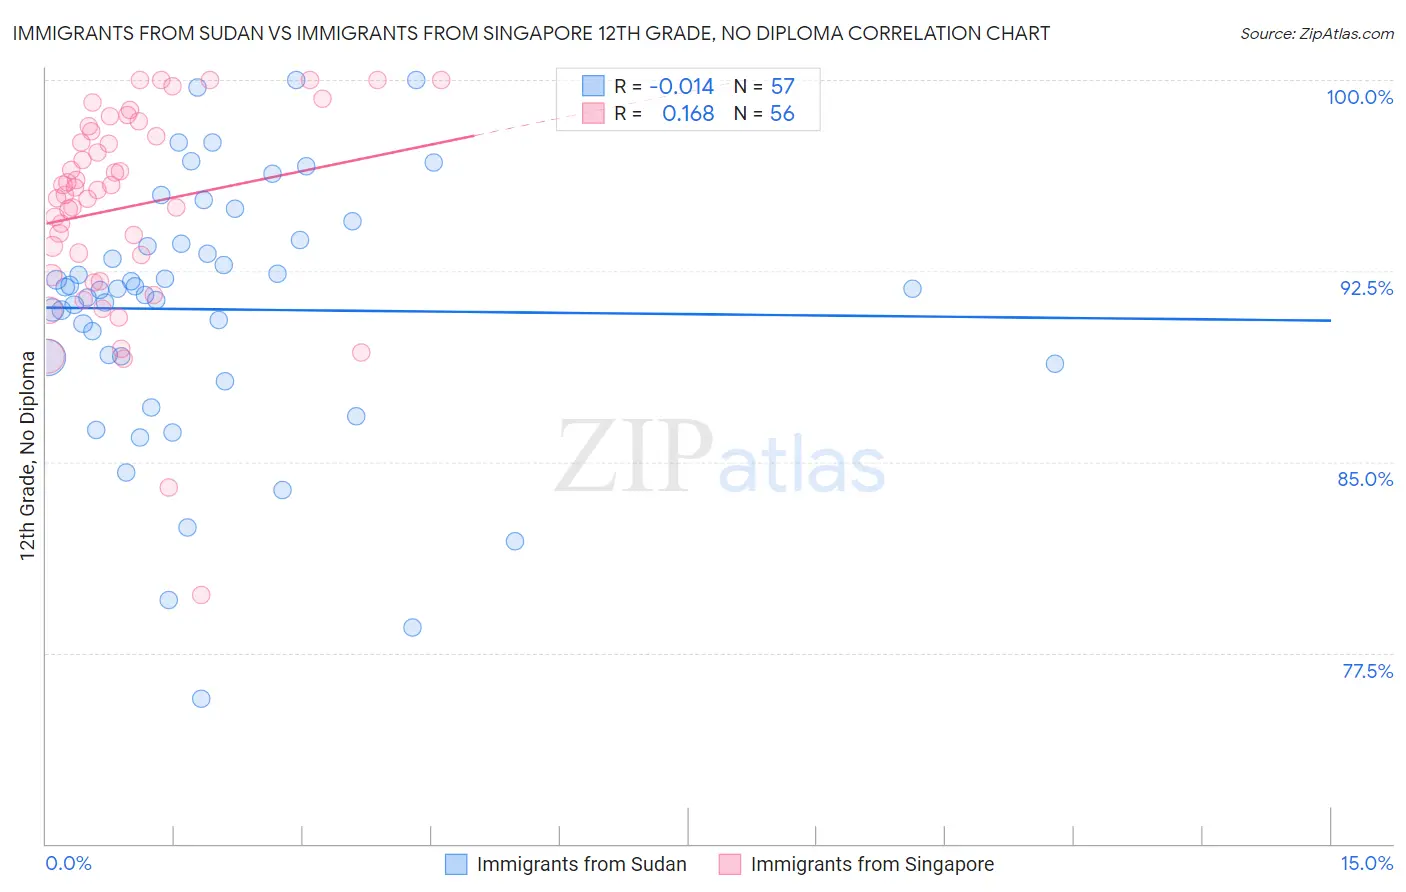
Immigrants from Sudan vs Immigrants from Singapore 12th Grade, No Diploma Correlation Chart
The statistical analysis conducted on geographies consisting of 118,959,807 people shows no correlation between the proportion of Immigrants from Sudan and percentage of population with at least 12th grade (no diploma) education in the United States with a correlation coefficient (R) of -0.014 and weighted average of 90.8%. Similarly, the statistical analysis conducted on geographies consisting of 137,521,094 people shows a poor positive correlation between the proportion of Immigrants from Singapore and percentage of population with at least 12th grade (no diploma) education in the United States with a correlation coefficient (R) of 0.168 and weighted average of 93.3%, a difference of 2.7%.
12th Grade, No Diploma Correlation Summary
| Measurement | Immigrants from Sudan | Immigrants from Singapore |
| Minimum | 75.7% | 79.8% |
| Maximum | 100.0% | 100.0% |
| Range | 24.3% | 20.2% |
| Mean | 91.0% | 95.0% |
| Median | 91.8% | 95.7% |
| Interquartile 25% (IQ1) | 89.0% | 92.7% |
| Interquartile 75% (IQ3) | 93.7% | 98.1% |
| Interquartile Range (IQR) | 4.7% | 5.4% |
| Standard Deviation (Sample) | 5.1% | 4.1% |
| Standard Deviation (Population) | 5.1% | 4.0% |
Similar Demographics by 12th Grade, No Diploma
Demographics Similar to Immigrants from Sudan by 12th Grade, No Diploma
In terms of 12th grade, no diploma, the demographic groups most similar to Immigrants from Sudan are Panamanian (90.8%, a difference of 0.0%), Korean (90.8%, a difference of 0.030%), Samoan (90.8%, a difference of 0.040%), Immigrants from Southern Europe (90.8%, a difference of 0.050%), and Liberian (90.8%, a difference of 0.050%).
| Demographics | Rating | Rank | 12th Grade, No Diploma |
| Afghans | 29.9 /100 | #190 | Fair 90.9% |
| Moroccans | 28.8 /100 | #191 | Fair 90.9% |
| Immigrants | Eastern Africa | 27.7 /100 | #192 | Fair 90.9% |
| Immigrants | Ethiopia | 27.2 /100 | #193 | Fair 90.9% |
| Immigrants | Oceania | 26.0 /100 | #194 | Fair 90.9% |
| Koreans | 24.5 /100 | #195 | Fair 90.8% |
| Panamanians | 22.8 /100 | #196 | Fair 90.8% |
| Immigrants | Sudan | 22.6 /100 | #197 | Fair 90.8% |
| Samoans | 20.4 /100 | #198 | Fair 90.8% |
| Immigrants | Southern Europe | 19.9 /100 | #199 | Poor 90.8% |
| Liberians | 19.8 /100 | #200 | Poor 90.8% |
| Hawaiians | 19.7 /100 | #201 | Poor 90.8% |
| Marshallese | 18.2 /100 | #202 | Poor 90.7% |
| Tongans | 16.1 /100 | #203 | Poor 90.7% |
| French American Indians | 15.5 /100 | #204 | Poor 90.7% |
Demographics Similar to Immigrants from Singapore by 12th Grade, No Diploma
In terms of 12th grade, no diploma, the demographic groups most similar to Immigrants from Singapore are German (93.3%, a difference of 0.020%), Luxembourger (93.3%, a difference of 0.030%), Maltese (93.3%, a difference of 0.050%), Filipino (93.2%, a difference of 0.050%), and Italian (93.2%, a difference of 0.070%).
| Demographics | Rating | Rank | 12th Grade, No Diploma |
| Poles | 100.0 /100 | #11 | Exceptional 93.5% |
| Eastern Europeans | 100.0 /100 | #12 | Exceptional 93.5% |
| Danes | 100.0 /100 | #13 | Exceptional 93.5% |
| Bulgarians | 100.0 /100 | #14 | Exceptional 93.5% |
| Finns | 100.0 /100 | #15 | Exceptional 93.4% |
| Maltese | 100.0 /100 | #16 | Exceptional 93.3% |
| Luxembourgers | 100.0 /100 | #17 | Exceptional 93.3% |
| Immigrants | Singapore | 99.9 /100 | #18 | Exceptional 93.3% |
| Germans | 99.9 /100 | #19 | Exceptional 93.3% |
| Filipinos | 99.9 /100 | #20 | Exceptional 93.2% |
| Italians | 99.9 /100 | #21 | Exceptional 93.2% |
| Estonians | 99.9 /100 | #22 | Exceptional 93.2% |
| Scandinavians | 99.9 /100 | #23 | Exceptional 93.2% |
| Thais | 99.9 /100 | #24 | Exceptional 93.2% |
| Czechs | 99.9 /100 | #25 | Exceptional 93.2% |