Welsh vs Immigrants from Philippines Nursery School
COMPARE
Welsh
Immigrants from Philippines
Nursery School
Nursery School Comparison
Welsh
Immigrants from Philippines
98.9%
NURSERY SCHOOL
100.0/ 100
METRIC RATING
3rd/ 347
METRIC RANK
97.5%
NURSERY SCHOOL
0.1/ 100
METRIC RATING
276th/ 347
METRIC RANK
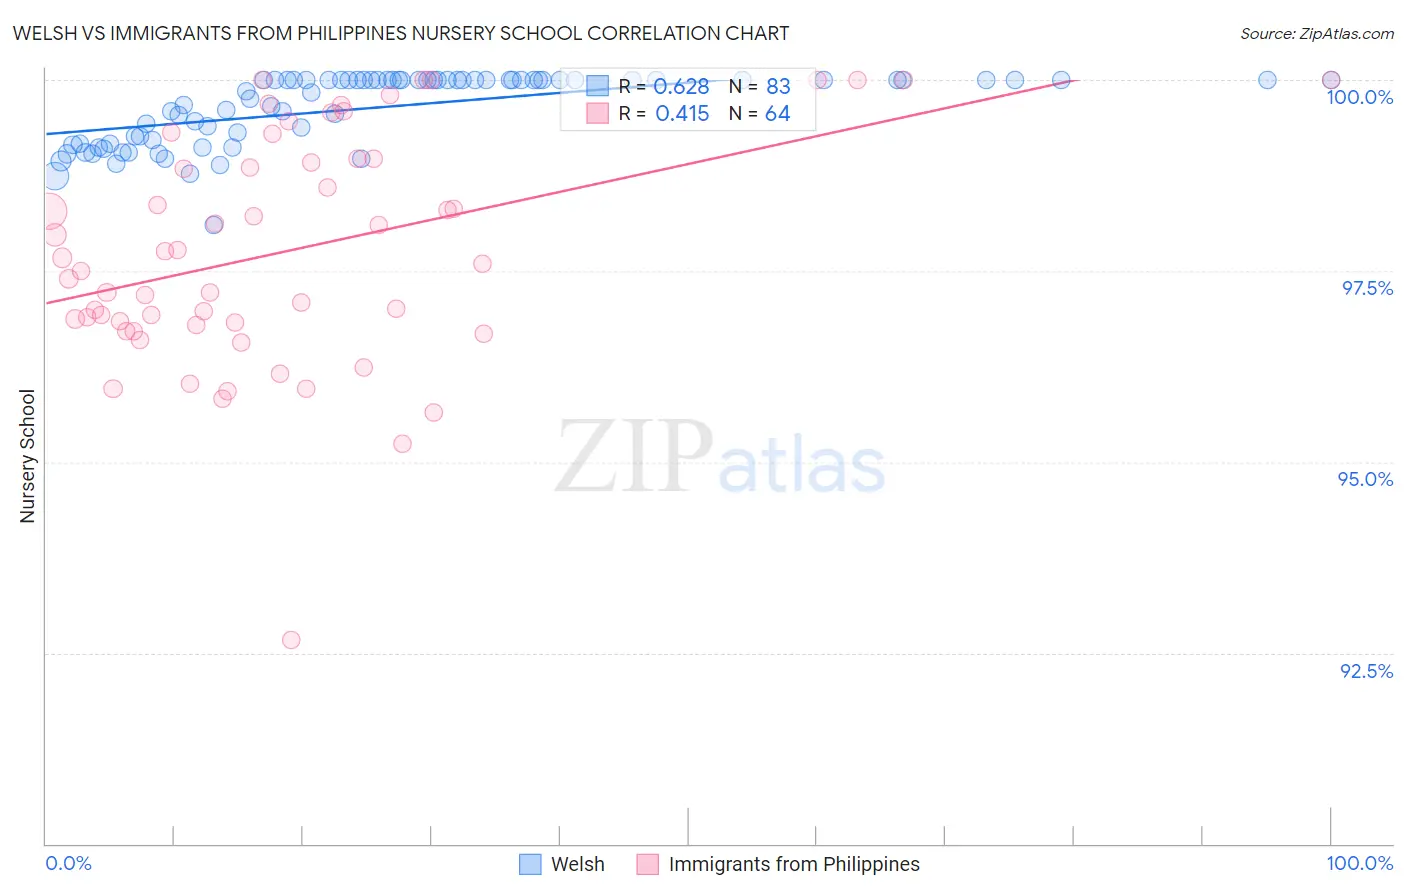
Welsh vs Immigrants from Philippines Nursery School Correlation Chart
The statistical analysis conducted on geographies consisting of 239,962,401 people shows a significant positive correlation between the proportion of Welsh and percentage of population with at least nursery school education in the United States with a correlation coefficient (R) of 0.628 and weighted average of 98.9%. Similarly, the statistical analysis conducted on geographies consisting of 471,303,140 people shows a moderate positive correlation between the proportion of Immigrants from Philippines and percentage of population with at least nursery school education in the United States with a correlation coefficient (R) of 0.415 and weighted average of 97.5%, a difference of 1.5%.
Nursery School Correlation Summary
| Measurement | Welsh | Immigrants from Philippines |
| Minimum | 98.1% | 92.7% |
| Maximum | 100.0% | 100.0% |
| Range | 1.9% | 7.3% |
| Mean | 99.6% | 97.8% |
| Median | 100.0% | 97.6% |
| Interquartile 25% (IQ1) | 99.2% | 96.8% |
| Interquartile 75% (IQ3) | 100.0% | 99.0% |
| Interquartile Range (IQR) | 0.83% | 2.2% |
| Standard Deviation (Sample) | 0.46% | 1.5% |
| Standard Deviation (Population) | 0.45% | 1.5% |
Similar Demographics by Nursery School
Demographics Similar to Welsh by Nursery School
In terms of nursery school, the demographic groups most similar to Welsh are Inupiat (98.9%, a difference of 0.0%), Tsimshian (98.9%, a difference of 0.030%), Alaskan Athabascan (98.8%, a difference of 0.10%), Alaska Native (98.8%, a difference of 0.13%), and Norwegian (98.7%, a difference of 0.15%).
| Demographics | Rating | Rank | Nursery School |
| Crow | 100.0 /100 | #1 | Exceptional 99.7% |
| Yup'ik | 100.0 /100 | #2 | Exceptional 99.2% |
| Welsh | 100.0 /100 | #3 | Exceptional 98.9% |
| Inupiat | 100.0 /100 | #4 | Exceptional 98.9% |
| Tsimshian | 100.0 /100 | #5 | Exceptional 98.9% |
| Alaskan Athabascans | 100.0 /100 | #6 | Exceptional 98.8% |
| Alaska Natives | 100.0 /100 | #7 | Exceptional 98.8% |
| Norwegians | 100.0 /100 | #8 | Exceptional 98.7% |
| Slovaks | 100.0 /100 | #9 | Exceptional 98.7% |
| Germans | 100.0 /100 | #10 | Exceptional 98.7% |
| Tlingit-Haida | 100.0 /100 | #11 | Exceptional 98.7% |
| Slovenes | 100.0 /100 | #12 | Exceptional 98.7% |
| English | 100.0 /100 | #13 | Exceptional 98.7% |
| Carpatho Rusyns | 100.0 /100 | #14 | Exceptional 98.7% |
| Swedes | 100.0 /100 | #15 | Exceptional 98.7% |
Demographics Similar to Immigrants from Philippines by Nursery School
In terms of nursery school, the demographic groups most similar to Immigrants from Philippines are Immigrants from Western Africa (97.4%, a difference of 0.010%), Immigrants from China (97.5%, a difference of 0.020%), Immigrants from Cameroon (97.5%, a difference of 0.020%), Ghanaian (97.5%, a difference of 0.020%), and Immigrants from Uzbekistan (97.4%, a difference of 0.030%).
| Demographics | Rating | Rank | Nursery School |
| Immigrants | Liberia | 0.3 /100 | #269 | Tragic 97.5% |
| Immigrants | Jamaica | 0.2 /100 | #270 | Tragic 97.5% |
| Immigrants | Peru | 0.2 /100 | #271 | Tragic 97.5% |
| Immigrants | Bolivia | 0.1 /100 | #272 | Tragic 97.5% |
| Immigrants | China | 0.1 /100 | #273 | Tragic 97.5% |
| Immigrants | Cameroon | 0.1 /100 | #274 | Tragic 97.5% |
| Ghanaians | 0.1 /100 | #275 | Tragic 97.5% |
| Immigrants | Philippines | 0.1 /100 | #276 | Tragic 97.5% |
| Immigrants | Western Africa | 0.1 /100 | #277 | Tragic 97.4% |
| Immigrants | Uzbekistan | 0.1 /100 | #278 | Tragic 97.4% |
| Immigrants | Ghana | 0.1 /100 | #279 | Tragic 97.4% |
| Barbadians | 0.0 /100 | #280 | Tragic 97.4% |
| Trinidadians and Tobagonians | 0.0 /100 | #281 | Tragic 97.4% |
| Afghans | 0.0 /100 | #282 | Tragic 97.4% |
| Immigrants | West Indies | 0.0 /100 | #283 | Tragic 97.4% |