French Canadian vs Dominican Associate's Degree
COMPARE
French Canadian
Dominican
Associate's Degree
Associate's Degree Comparison
French Canadians
Dominicans
44.9%
ASSOCIATE'S DEGREE
15.0/ 100
METRIC RATING
212th/ 347
METRIC RANK
39.3%
ASSOCIATE'S DEGREE
0.0/ 100
METRIC RATING
291st/ 347
METRIC RANK
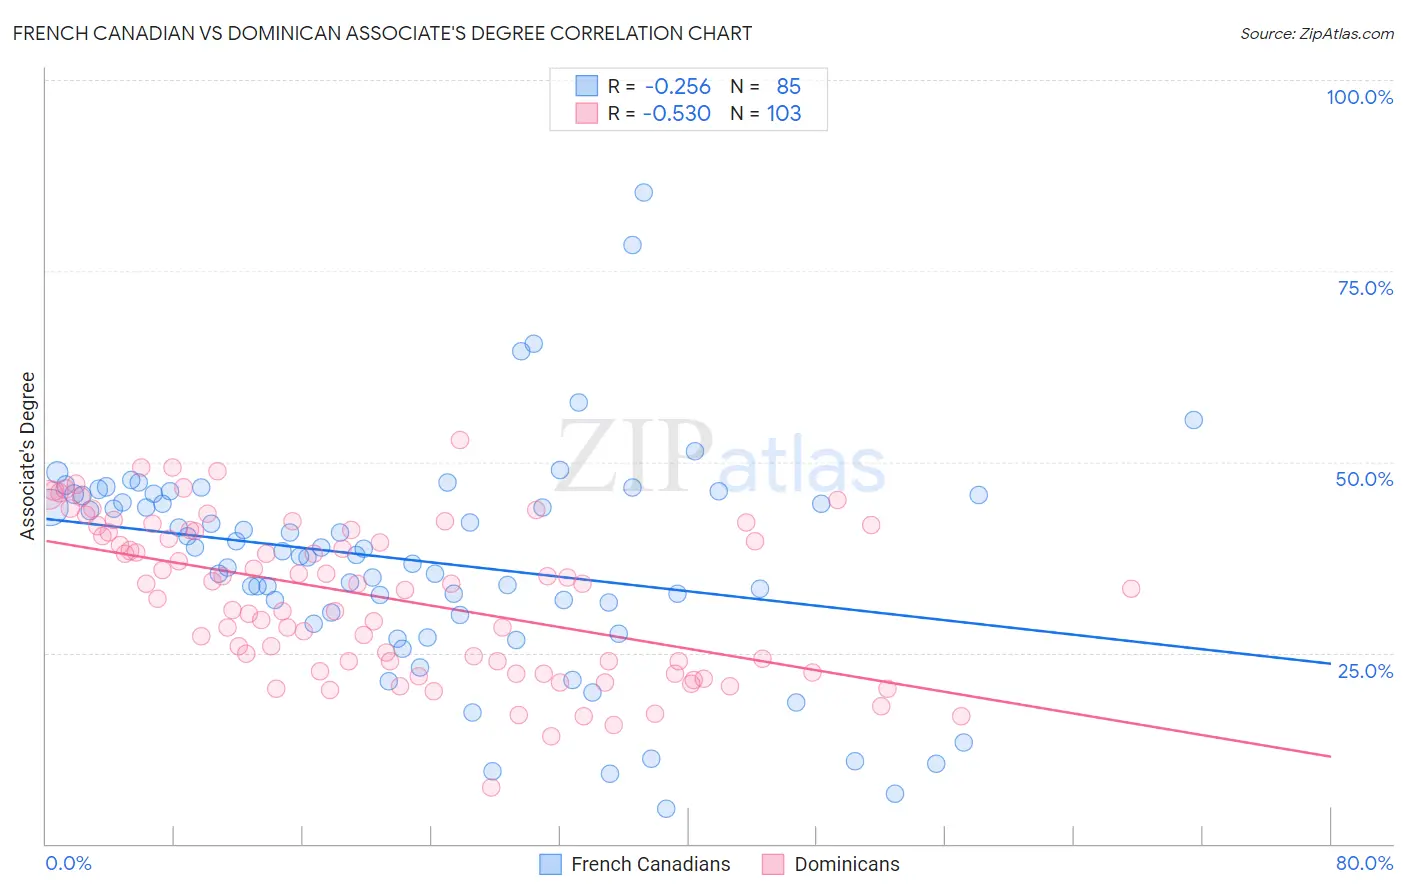
French Canadian vs Dominican Associate's Degree Correlation Chart
The statistical analysis conducted on geographies consisting of 502,638,866 people shows a weak negative correlation between the proportion of French Canadians and percentage of population with at least associate's degree education in the United States with a correlation coefficient (R) of -0.256 and weighted average of 44.9%. Similarly, the statistical analysis conducted on geographies consisting of 355,098,353 people shows a substantial negative correlation between the proportion of Dominicans and percentage of population with at least associate's degree education in the United States with a correlation coefficient (R) of -0.530 and weighted average of 39.3%, a difference of 14.2%.
Associate's Degree Correlation Summary
| Measurement | French Canadian | Dominican |
| Minimum | 4.6% | 7.4% |
| Maximum | 85.2% | 52.8% |
| Range | 80.6% | 45.4% |
| Mean | 37.0% | 32.3% |
| Median | 38.2% | 34.0% |
| Interquartile 25% (IQ1) | 30.1% | 23.8% |
| Interquartile 75% (IQ3) | 45.7% | 41.0% |
| Interquartile Range (IQR) | 15.6% | 17.2% |
| Standard Deviation (Sample) | 14.4% | 10.0% |
| Standard Deviation (Population) | 14.3% | 10.0% |
Similar Demographics by Associate's Degree
Demographics Similar to French Canadians by Associate's Degree
In terms of associate's degree, the demographic groups most similar to French Canadians are Immigrants from Ghana (44.8%, a difference of 0.12%), Immigrants from Zaire (45.0%, a difference of 0.23%), Immigrants from Philippines (45.0%, a difference of 0.24%), Immigrants from Costa Rica (45.0%, a difference of 0.25%), and Dutch (45.0%, a difference of 0.36%).
| Demographics | Rating | Rank | Associate's Degree |
| Immigrants | Thailand | 18.9 /100 | #205 | Poor 45.1% |
| German Russians | 18.9 /100 | #206 | Poor 45.1% |
| Panamanians | 18.4 /100 | #207 | Poor 45.1% |
| Dutch | 17.6 /100 | #208 | Poor 45.0% |
| Immigrants | Costa Rica | 16.7 /100 | #209 | Poor 45.0% |
| Immigrants | Philippines | 16.7 /100 | #210 | Poor 45.0% |
| Immigrants | Zaire | 16.6 /100 | #211 | Poor 45.0% |
| French Canadians | 15.0 /100 | #212 | Poor 44.9% |
| Immigrants | Ghana | 14.2 /100 | #213 | Poor 44.8% |
| Immigrants | Middle Africa | 12.7 /100 | #214 | Poor 44.7% |
| Immigrants | Panama | 12.4 /100 | #215 | Poor 44.7% |
| Immigrants | Nigeria | 11.4 /100 | #216 | Poor 44.6% |
| Immigrants | Immigrants | 10.5 /100 | #217 | Poor 44.5% |
| Spanish | 9.4 /100 | #218 | Tragic 44.4% |
| Whites/Caucasians | 7.5 /100 | #219 | Tragic 44.2% |
Demographics Similar to Dominicans by Associate's Degree
In terms of associate's degree, the demographic groups most similar to Dominicans are Immigrants from Haiti (39.3%, a difference of 0.010%), Black/African American (39.1%, a difference of 0.29%), Central American (39.4%, a difference of 0.46%), Nepalese (39.0%, a difference of 0.54%), and Salvadoran (39.0%, a difference of 0.54%).
| Demographics | Rating | Rank | Associate's Degree |
| Comanche | 0.1 /100 | #284 | Tragic 39.9% |
| Immigrants | Belize | 0.1 /100 | #285 | Tragic 39.9% |
| Immigrants | Caribbean | 0.0 /100 | #286 | Tragic 39.7% |
| Aleuts | 0.0 /100 | #287 | Tragic 39.6% |
| Immigrants | Cuba | 0.0 /100 | #288 | Tragic 39.5% |
| Central Americans | 0.0 /100 | #289 | Tragic 39.4% |
| Immigrants | Haiti | 0.0 /100 | #290 | Tragic 39.3% |
| Dominicans | 0.0 /100 | #291 | Tragic 39.3% |
| Blacks/African Americans | 0.0 /100 | #292 | Tragic 39.1% |
| Nepalese | 0.0 /100 | #293 | Tragic 39.0% |
| Salvadorans | 0.0 /100 | #294 | Tragic 39.0% |
| Hondurans | 0.0 /100 | #295 | Tragic 38.9% |
| Cherokee | 0.0 /100 | #296 | Tragic 38.9% |
| Cape Verdeans | 0.0 /100 | #297 | Tragic 38.8% |
| Cheyenne | 0.0 /100 | #298 | Tragic 38.7% |