Immigrants from Burma/Myanmar vs Dominican 7th Grade
COMPARE
Immigrants from Burma/Myanmar
Dominican
7th Grade
7th Grade Comparison
Immigrants from Burma/Myanmar
Dominicans
94.5%
7TH GRADE
0.0/ 100
METRIC RATING
300th/ 347
METRIC RANK
93.3%
7TH GRADE
0.0/ 100
METRIC RATING
324th/ 347
METRIC RANK
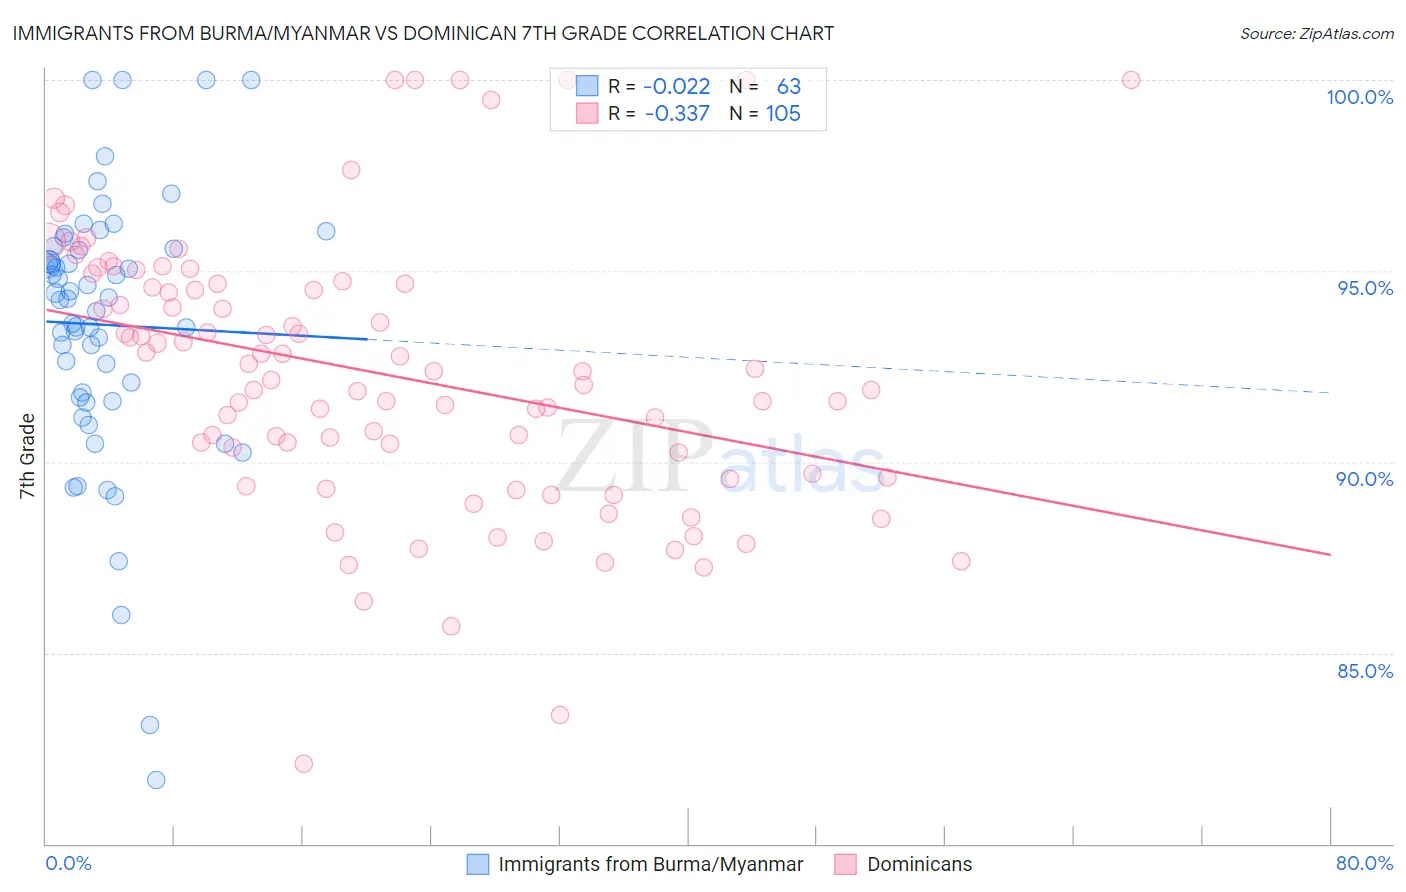
Immigrants from Burma/Myanmar vs Dominican 7th Grade Correlation Chart
The statistical analysis conducted on geographies consisting of 172,345,696 people shows no correlation between the proportion of Immigrants from Burma/Myanmar and percentage of population with at least 7th grade education in the United States with a correlation coefficient (R) of -0.022 and weighted average of 94.5%. Similarly, the statistical analysis conducted on geographies consisting of 355,142,603 people shows a mild negative correlation between the proportion of Dominicans and percentage of population with at least 7th grade education in the United States with a correlation coefficient (R) of -0.337 and weighted average of 93.3%, a difference of 1.2%.
7th Grade Correlation Summary
| Measurement | Immigrants from Burma/Myanmar | Dominican |
| Minimum | 81.7% | 82.1% |
| Maximum | 100.0% | 100.0% |
| Range | 18.3% | 17.9% |
| Mean | 93.6% | 92.3% |
| Median | 94.3% | 92.4% |
| Interquartile 25% (IQ1) | 91.7% | 89.6% |
| Interquartile 75% (IQ3) | 95.6% | 94.7% |
| Interquartile Range (IQR) | 3.9% | 5.0% |
| Standard Deviation (Sample) | 3.6% | 3.6% |
| Standard Deviation (Population) | 3.5% | 3.6% |
Similar Demographics by 7th Grade
Demographics Similar to Immigrants from Burma/Myanmar by 7th Grade
In terms of 7th grade, the demographic groups most similar to Immigrants from Burma/Myanmar are Immigrants from Dominica (94.5%, a difference of 0.030%), Immigrants from Laos (94.5%, a difference of 0.030%), Immigrants from South Eastern Asia (94.5%, a difference of 0.040%), Indonesian (94.5%, a difference of 0.040%), and Bangladeshi (94.5%, a difference of 0.040%).
| Demographics | Rating | Rank | 7th Grade |
| Fijians | 0.0 /100 | #293 | Tragic 94.7% |
| Haitians | 0.0 /100 | #294 | Tragic 94.7% |
| Yaqui | 0.0 /100 | #295 | Tragic 94.6% |
| Cubans | 0.0 /100 | #296 | Tragic 94.6% |
| Immigrants | South Eastern Asia | 0.0 /100 | #297 | Tragic 94.5% |
| Indonesians | 0.0 /100 | #298 | Tragic 94.5% |
| Bangladeshis | 0.0 /100 | #299 | Tragic 94.5% |
| Immigrants | Burma/Myanmar | 0.0 /100 | #300 | Tragic 94.5% |
| Immigrants | Dominica | 0.0 /100 | #301 | Tragic 94.5% |
| Immigrants | Laos | 0.0 /100 | #302 | Tragic 94.5% |
| Sri Lankans | 0.0 /100 | #303 | Tragic 94.4% |
| Immigrants | Haiti | 0.0 /100 | #304 | Tragic 94.3% |
| Guyanese | 0.0 /100 | #305 | Tragic 94.3% |
| Immigrants | Guyana | 0.0 /100 | #306 | Tragic 94.2% |
| Immigrants | Portugal | 0.0 /100 | #307 | Tragic 94.2% |
Demographics Similar to Dominicans by 7th Grade
In terms of 7th grade, the demographic groups most similar to Dominicans are Immigrants from Belize (93.4%, a difference of 0.020%), Central American Indian (93.3%, a difference of 0.070%), Nicaraguan (93.5%, a difference of 0.13%), Belizean (93.5%, a difference of 0.16%), and Nepalese (93.2%, a difference of 0.18%).
| Demographics | Rating | Rank | 7th Grade |
| Immigrants | Cuba | 0.0 /100 | #317 | Tragic 93.8% |
| Immigrants | Ecuador | 0.0 /100 | #318 | Tragic 93.7% |
| Immigrants | Cambodia | 0.0 /100 | #319 | Tragic 93.7% |
| Immigrants | Fiji | 0.0 /100 | #320 | Tragic 93.5% |
| Belizeans | 0.0 /100 | #321 | Tragic 93.5% |
| Nicaraguans | 0.0 /100 | #322 | Tragic 93.5% |
| Immigrants | Belize | 0.0 /100 | #323 | Tragic 93.4% |
| Dominicans | 0.0 /100 | #324 | Tragic 93.3% |
| Central American Indians | 0.0 /100 | #325 | Tragic 93.3% |
| Nepalese | 0.0 /100 | #326 | Tragic 93.2% |
| Immigrants | Cabo Verde | 0.0 /100 | #327 | Tragic 93.1% |
| Immigrants | Nicaragua | 0.0 /100 | #328 | Tragic 93.0% |
| Immigrants | Azores | 0.0 /100 | #329 | Tragic 93.0% |
| Immigrants | Dominican Republic | 0.0 /100 | #330 | Tragic 92.9% |
| Hondurans | 0.0 /100 | #331 | Tragic 92.9% |