Immigrants from Bosnia and Herzegovina vs Brazilian Nursery School
COMPARE
Immigrants from Bosnia and Herzegovina
Brazilian
Nursery School
Nursery School Comparison
Immigrants from Bosnia and Herzegovina
Brazilians
98.0%
NURSERY SCHOOL
45.6/ 100
METRIC RATING
180th/ 347
METRIC RANK
98.0%
NURSERY SCHOOL
59.4/ 100
METRIC RATING
162nd/ 347
METRIC RANK
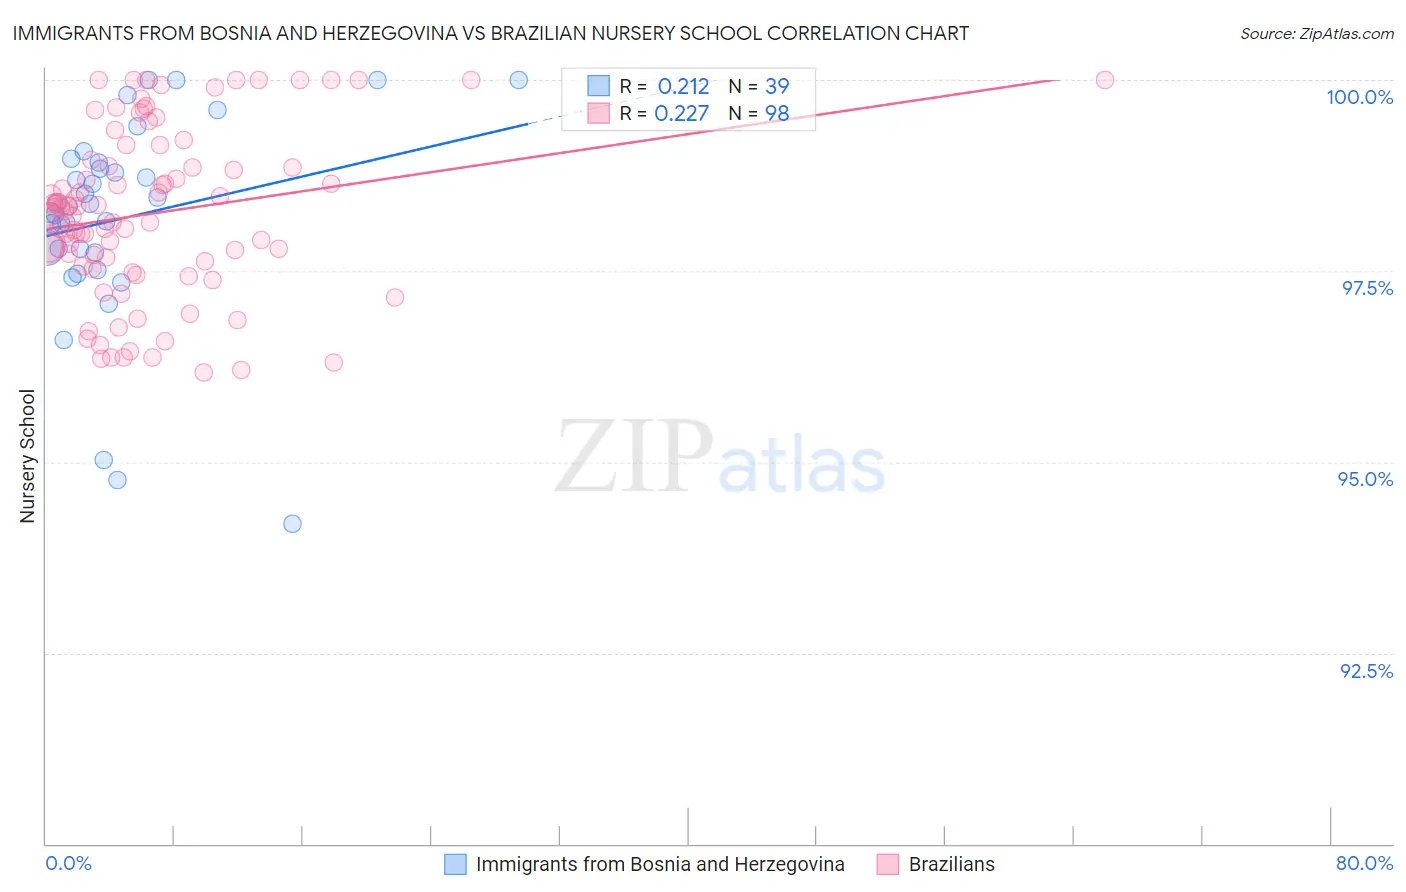
Immigrants from Bosnia and Herzegovina vs Brazilian Nursery School Correlation Chart
The statistical analysis conducted on geographies consisting of 156,779,463 people shows a weak positive correlation between the proportion of Immigrants from Bosnia and Herzegovina and percentage of population with at least nursery school education in the United States with a correlation coefficient (R) of 0.212 and weighted average of 98.0%. Similarly, the statistical analysis conducted on geographies consisting of 323,863,770 people shows a weak positive correlation between the proportion of Brazilians and percentage of population with at least nursery school education in the United States with a correlation coefficient (R) of 0.227 and weighted average of 98.0%, a difference of 0.040%.
Nursery School Correlation Summary
| Measurement | Immigrants from Bosnia and Herzegovina | Brazilian |
| Minimum | 94.2% | 96.2% |
| Maximum | 100.0% | 100.0% |
| Range | 5.8% | 3.8% |
| Mean | 98.2% | 98.3% |
| Median | 98.3% | 98.3% |
| Interquartile 25% (IQ1) | 97.7% | 97.6% |
| Interquartile 75% (IQ3) | 98.9% | 99.0% |
| Interquartile Range (IQR) | 1.2% | 1.4% |
| Standard Deviation (Sample) | 1.3% | 1.1% |
| Standard Deviation (Population) | 1.3% | 1.1% |
Demographics Similar to Immigrants from Bosnia and Herzegovina and Brazilians by Nursery School
In terms of nursery school, the demographic groups most similar to Immigrants from Bosnia and Herzegovina are Argentinean (98.0%, a difference of 0.0%), Kenyan (98.0%, a difference of 0.010%), Navajo (98.0%, a difference of 0.010%), Immigrants from Sri Lanka (98.0%, a difference of 0.010%), and Immigrants from Venezuela (98.0%, a difference of 0.010%). Similarly, the demographic groups most similar to Brazilians are Immigrants from Eastern Europe (98.0%, a difference of 0.0%), Immigrants from Italy (98.0%, a difference of 0.0%), Ugandan (98.0%, a difference of 0.010%), Chilean (98.0%, a difference of 0.010%), and Spanish American (98.0%, a difference of 0.010%).
| Demographics | Rating | Rank | Nursery School |
| Immigrants | Eastern Europe | 59.7 /100 | #161 | Average 98.0% |
| Brazilians | 59.4 /100 | #162 | Average 98.0% |
| Immigrants | Italy | 59.0 /100 | #163 | Average 98.0% |
| Ugandans | 56.4 /100 | #164 | Average 98.0% |
| Chileans | 56.4 /100 | #165 | Average 98.0% |
| Spanish Americans | 55.6 /100 | #166 | Average 98.0% |
| Immigrants | Spain | 55.6 /100 | #167 | Average 98.0% |
| Immigrants | Micronesia | 55.0 /100 | #168 | Average 98.0% |
| Immigrants | Korea | 53.8 /100 | #169 | Average 98.0% |
| Bermudans | 53.7 /100 | #170 | Average 98.0% |
| Immigrants | Jordan | 53.4 /100 | #171 | Average 98.0% |
| Immigrants | Brazil | 51.3 /100 | #172 | Average 98.0% |
| Kenyans | 50.2 /100 | #173 | Average 98.0% |
| Navajo | 50.0 /100 | #174 | Average 98.0% |
| Immigrants | Sri Lanka | 49.9 /100 | #175 | Average 98.0% |
| Immigrants | Venezuela | 49.8 /100 | #176 | Average 98.0% |
| Albanians | 48.9 /100 | #177 | Average 98.0% |
| Natives/Alaskans | 48.6 /100 | #178 | Average 98.0% |
| Argentineans | 46.8 /100 | #179 | Average 98.0% |
| Immigrants | Bosnia and Herzegovina | 45.6 /100 | #180 | Average 98.0% |
| Egyptians | 42.8 /100 | #181 | Average 98.0% |