Immigrants from Bosnia and Herzegovina vs Mexican Nursery School
COMPARE
Immigrants from Bosnia and Herzegovina
Mexican
Nursery School
Nursery School Comparison
Immigrants from Bosnia and Herzegovina
Mexicans
98.0%
NURSERY SCHOOL
45.6/ 100
METRIC RATING
180th/ 347
METRIC RANK
96.8%
NURSERY SCHOOL
0.0/ 100
METRIC RATING
327th/ 347
METRIC RANK
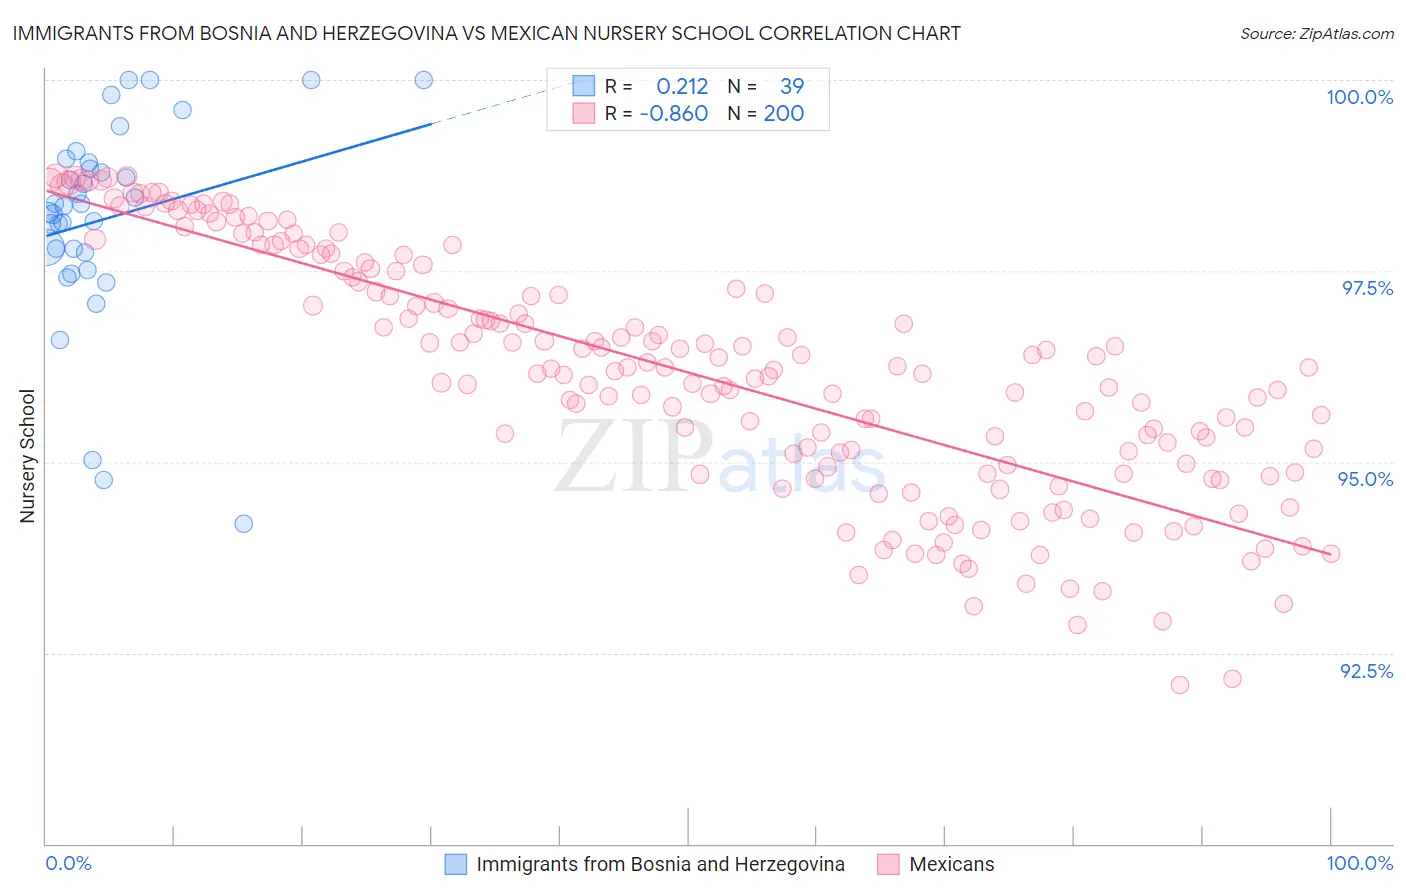
Immigrants from Bosnia and Herzegovina vs Mexican Nursery School Correlation Chart
The statistical analysis conducted on geographies consisting of 156,779,463 people shows a weak positive correlation between the proportion of Immigrants from Bosnia and Herzegovina and percentage of population with at least nursery school education in the United States with a correlation coefficient (R) of 0.212 and weighted average of 98.0%. Similarly, the statistical analysis conducted on geographies consisting of 565,340,458 people shows a very strong negative correlation between the proportion of Mexicans and percentage of population with at least nursery school education in the United States with a correlation coefficient (R) of -0.860 and weighted average of 96.8%, a difference of 1.3%.
Nursery School Correlation Summary
| Measurement | Immigrants from Bosnia and Herzegovina | Mexican |
| Minimum | 94.2% | 92.1% |
| Maximum | 100.0% | 98.7% |
| Range | 5.8% | 6.7% |
| Mean | 98.2% | 96.2% |
| Median | 98.3% | 96.2% |
| Interquartile 25% (IQ1) | 97.7% | 94.9% |
| Interquartile 75% (IQ3) | 98.9% | 97.5% |
| Interquartile Range (IQR) | 1.2% | 2.6% |
| Standard Deviation (Sample) | 1.3% | 1.6% |
| Standard Deviation (Population) | 1.3% | 1.6% |
Similar Demographics by Nursery School
Demographics Similar to Immigrants from Bosnia and Herzegovina by Nursery School
In terms of nursery school, the demographic groups most similar to Immigrants from Bosnia and Herzegovina are Argentinean (98.0%, a difference of 0.0%), Kenyan (98.0%, a difference of 0.010%), Navajo (98.0%, a difference of 0.010%), Immigrants from Sri Lanka (98.0%, a difference of 0.010%), and Immigrants from Venezuela (98.0%, a difference of 0.010%).
| Demographics | Rating | Rank | Nursery School |
| Kenyans | 50.2 /100 | #173 | Average 98.0% |
| Navajo | 50.0 /100 | #174 | Average 98.0% |
| Immigrants | Sri Lanka | 49.9 /100 | #175 | Average 98.0% |
| Immigrants | Venezuela | 49.8 /100 | #176 | Average 98.0% |
| Albanians | 48.9 /100 | #177 | Average 98.0% |
| Natives/Alaskans | 48.6 /100 | #178 | Average 98.0% |
| Argentineans | 46.8 /100 | #179 | Average 98.0% |
| Immigrants | Bosnia and Herzegovina | 45.6 /100 | #180 | Average 98.0% |
| Egyptians | 42.8 /100 | #181 | Average 98.0% |
| Paiute | 42.0 /100 | #182 | Average 98.0% |
| Portuguese | 41.8 /100 | #183 | Average 98.0% |
| Immigrants | Poland | 41.3 /100 | #184 | Average 98.0% |
| Immigrants | Belarus | 41.0 /100 | #185 | Average 98.0% |
| Immigrants | Argentina | 40.8 /100 | #186 | Average 98.0% |
| Immigrants | Kazakhstan | 37.1 /100 | #187 | Fair 97.9% |
Demographics Similar to Mexicans by Nursery School
In terms of nursery school, the demographic groups most similar to Mexicans are Immigrants from Latin America (96.7%, a difference of 0.010%), Indonesian (96.8%, a difference of 0.060%), Immigrants from Vietnam (96.7%, a difference of 0.060%), Dominican (96.8%, a difference of 0.070%), and Japanese (96.7%, a difference of 0.070%).
| Demographics | Rating | Rank | Nursery School |
| Immigrants | Burma/Myanmar | 0.0 /100 | #320 | Tragic 96.9% |
| Immigrants | Bangladesh | 0.0 /100 | #321 | Tragic 96.9% |
| Mexican American Indians | 0.0 /100 | #322 | Tragic 96.9% |
| Immigrants | Honduras | 0.0 /100 | #323 | Tragic 96.9% |
| Vietnamese | 0.0 /100 | #324 | Tragic 96.8% |
| Dominicans | 0.0 /100 | #325 | Tragic 96.8% |
| Indonesians | 0.0 /100 | #326 | Tragic 96.8% |
| Mexicans | 0.0 /100 | #327 | Tragic 96.8% |
| Immigrants | Latin America | 0.0 /100 | #328 | Tragic 96.7% |
| Immigrants | Vietnam | 0.0 /100 | #329 | Tragic 96.7% |
| Japanese | 0.0 /100 | #330 | Tragic 96.7% |
| Immigrants | Armenia | 0.0 /100 | #331 | Tragic 96.7% |
| Yakama | 0.0 /100 | #332 | Tragic 96.6% |
| Central Americans | 0.0 /100 | #333 | Tragic 96.6% |
| Immigrants | Dominican Republic | 0.0 /100 | #334 | Tragic 96.6% |