Immigrants from Bolivia vs Tohono O'odham Nursery School
COMPARE
Immigrants from Bolivia
Tohono O'odham
Nursery School
Nursery School Comparison
Immigrants from Bolivia
Tohono O'odham
97.5%
NURSERY SCHOOL
0.1/ 100
METRIC RATING
272nd/ 347
METRIC RANK
97.9%
NURSERY SCHOOL
22.2/ 100
METRIC RATING
200th/ 347
METRIC RANK
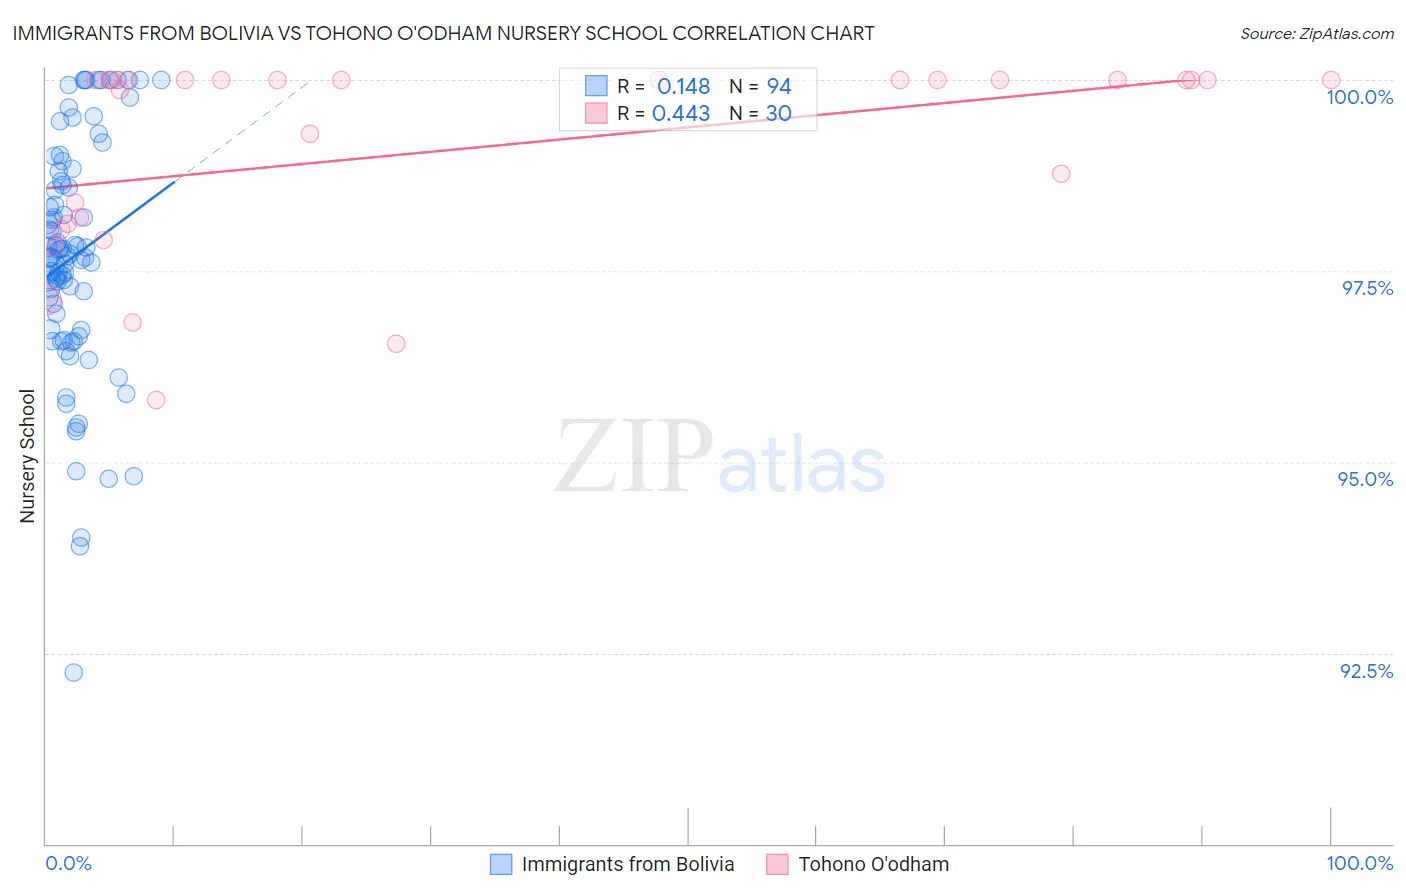
Immigrants from Bolivia vs Tohono O'odham Nursery School Correlation Chart
The statistical analysis conducted on geographies consisting of 158,728,833 people shows a poor positive correlation between the proportion of Immigrants from Bolivia and percentage of population with at least nursery school education in the United States with a correlation coefficient (R) of 0.148 and weighted average of 97.5%. Similarly, the statistical analysis conducted on geographies consisting of 58,723,100 people shows a moderate positive correlation between the proportion of Tohono O'odham and percentage of population with at least nursery school education in the United States with a correlation coefficient (R) of 0.443 and weighted average of 97.9%, a difference of 0.40%.
Nursery School Correlation Summary
| Measurement | Immigrants from Bolivia | Tohono O'odham |
| Minimum | 92.2% | 95.8% |
| Maximum | 100.0% | 100.0% |
| Range | 7.8% | 4.2% |
| Mean | 97.7% | 99.1% |
| Median | 97.7% | 100.0% |
| Interquartile 25% (IQ1) | 96.7% | 98.1% |
| Interquartile 75% (IQ3) | 98.7% | 100.0% |
| Interquartile Range (IQR) | 1.9% | 1.9% |
| Standard Deviation (Sample) | 1.5% | 1.3% |
| Standard Deviation (Population) | 1.5% | 1.3% |
Similar Demographics by Nursery School
Demographics Similar to Immigrants from Bolivia by Nursery School
In terms of nursery school, the demographic groups most similar to Immigrants from Bolivia are Immigrants from Peru (97.5%, a difference of 0.020%), Immigrants from China (97.5%, a difference of 0.020%), Immigrants from Cameroon (97.5%, a difference of 0.020%), Ghanaian (97.5%, a difference of 0.020%), and Immigrants from Jamaica (97.5%, a difference of 0.030%).
| Demographics | Rating | Rank | Nursery School |
| Assyrians/Chaldeans/Syriacs | 0.3 /100 | #265 | Tragic 97.6% |
| Immigrants | Sierra Leone | 0.3 /100 | #266 | Tragic 97.6% |
| Immigrants | Nigeria | 0.3 /100 | #267 | Tragic 97.5% |
| West Indians | 0.3 /100 | #268 | Tragic 97.5% |
| Immigrants | Liberia | 0.3 /100 | #269 | Tragic 97.5% |
| Immigrants | Jamaica | 0.2 /100 | #270 | Tragic 97.5% |
| Immigrants | Peru | 0.2 /100 | #271 | Tragic 97.5% |
| Immigrants | Bolivia | 0.1 /100 | #272 | Tragic 97.5% |
| Immigrants | China | 0.1 /100 | #273 | Tragic 97.5% |
| Immigrants | Cameroon | 0.1 /100 | #274 | Tragic 97.5% |
| Ghanaians | 0.1 /100 | #275 | Tragic 97.5% |
| Immigrants | Philippines | 0.1 /100 | #276 | Tragic 97.5% |
| Immigrants | Western Africa | 0.1 /100 | #277 | Tragic 97.4% |
| Immigrants | Uzbekistan | 0.1 /100 | #278 | Tragic 97.4% |
| Immigrants | Ghana | 0.1 /100 | #279 | Tragic 97.4% |
Demographics Similar to Tohono O'odham by Nursery School
In terms of nursery school, the demographic groups most similar to Tohono O'odham are Immigrants from Egypt (97.9%, a difference of 0.0%), Immigrants from Lebanon (97.9%, a difference of 0.0%), Guamanian/Chamorro (97.9%, a difference of 0.010%), Yuman (97.9%, a difference of 0.010%), and Immigrants from Kenya (97.9%, a difference of 0.010%).
| Demographics | Rating | Rank | Nursery School |
| Paraguayans | 27.4 /100 | #193 | Fair 97.9% |
| Mongolians | 27.3 /100 | #194 | Fair 97.9% |
| Hawaiians | 27.2 /100 | #195 | Fair 97.9% |
| Guamanians/Chamorros | 25.7 /100 | #196 | Fair 97.9% |
| Yuman | 25.7 /100 | #197 | Fair 97.9% |
| Immigrants | Kenya | 24.1 /100 | #198 | Fair 97.9% |
| Immigrants | Egypt | 22.5 /100 | #199 | Fair 97.9% |
| Tohono O'odham | 22.2 /100 | #200 | Fair 97.9% |
| Immigrants | Lebanon | 21.2 /100 | #201 | Fair 97.9% |
| Immigrants | Ukraine | 19.9 /100 | #202 | Poor 97.9% |
| Immigrants | Uganda | 18.0 /100 | #203 | Poor 97.9% |
| Immigrants | Southern Europe | 17.4 /100 | #204 | Poor 97.9% |
| Immigrants | Chile | 17.3 /100 | #205 | Poor 97.9% |
| Immigrants | Albania | 16.4 /100 | #206 | Poor 97.9% |
| Africans | 15.4 /100 | #207 | Poor 97.9% |