Immigrants from Bolivia vs Tohono O'odham Median Earnings
COMPARE
Immigrants from Bolivia
Tohono O'odham
Median Earnings
Median Earnings Comparison
Immigrants from Bolivia
Tohono O'odham
$51,605
MEDIAN EARNINGS
99.9/ 100
METRIC RATING
58th/ 347
METRIC RANK
$36,349
MEDIAN EARNINGS
0.0/ 100
METRIC RATING
345th/ 347
METRIC RANK
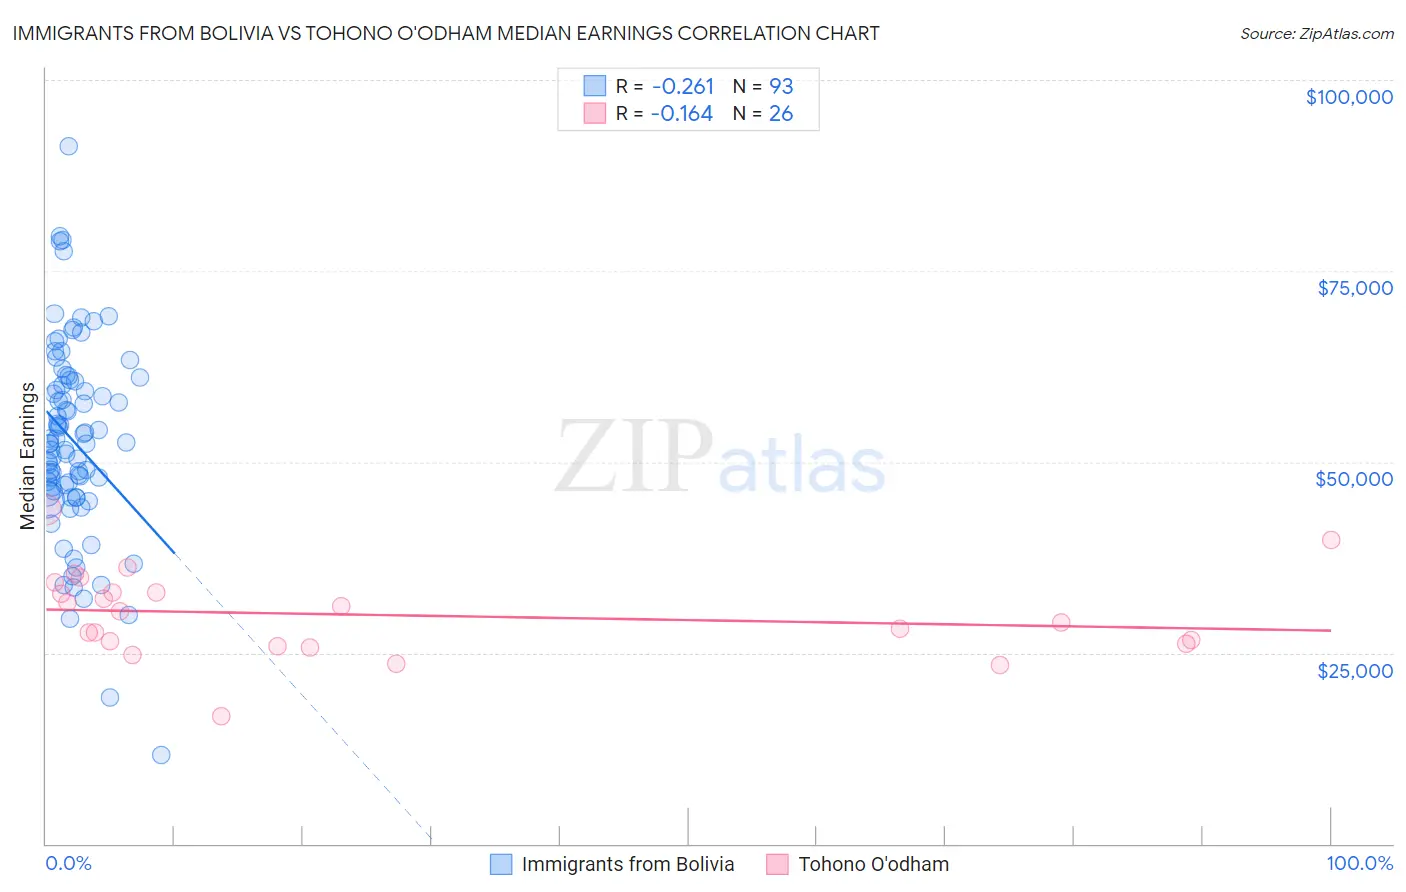
Immigrants from Bolivia vs Tohono O'odham Median Earnings Correlation Chart
The statistical analysis conducted on geographies consisting of 158,712,094 people shows a weak negative correlation between the proportion of Immigrants from Bolivia and median earnings in the United States with a correlation coefficient (R) of -0.261 and weighted average of $51,605. Similarly, the statistical analysis conducted on geographies consisting of 58,728,293 people shows a poor negative correlation between the proportion of Tohono O'odham and median earnings in the United States with a correlation coefficient (R) of -0.164 and weighted average of $36,349, a difference of 42.0%.
Median Earnings Correlation Summary
| Measurement | Immigrants from Bolivia | Tohono O'odham |
| Minimum | $11,650 | $16,641 |
| Maximum | $91,262 | $43,705 |
| Range | $79,612 | $27,064 |
| Mean | $52,755 | $29,971 |
| Median | $52,407 | $29,707 |
| Interquartile 25% (IQ1) | $46,026 | $26,250 |
| Interquartile 75% (IQ3) | $60,689 | $32,909 |
| Interquartile Range (IQR) | $14,663 | $6,659 |
| Standard Deviation (Sample) | $12,931 | $5,663 |
| Standard Deviation (Population) | $12,861 | $5,553 |
Similar Demographics by Median Earnings
Demographics Similar to Immigrants from Bolivia by Median Earnings
In terms of median earnings, the demographic groups most similar to Immigrants from Bolivia are Immigrants from Eastern Europe ($51,624, a difference of 0.040%), Immigrants from Croatia ($51,581, a difference of 0.050%), Immigrants from Serbia ($51,557, a difference of 0.090%), Immigrants from Latvia ($51,555, a difference of 0.10%), and Immigrants from Pakistan ($51,693, a difference of 0.17%).
| Demographics | Rating | Rank | Median Earnings |
| Immigrants | Austria | 99.9 /100 | #51 | Exceptional $51,826 |
| Estonians | 99.9 /100 | #52 | Exceptional $51,772 |
| Immigrants | Norway | 99.9 /100 | #53 | Exceptional $51,758 |
| Immigrants | Indonesia | 99.9 /100 | #54 | Exceptional $51,715 |
| Egyptians | 99.9 /100 | #55 | Exceptional $51,701 |
| Immigrants | Pakistan | 99.9 /100 | #56 | Exceptional $51,693 |
| Immigrants | Eastern Europe | 99.9 /100 | #57 | Exceptional $51,624 |
| Immigrants | Bolivia | 99.9 /100 | #58 | Exceptional $51,605 |
| Immigrants | Croatia | 99.9 /100 | #59 | Exceptional $51,581 |
| Immigrants | Serbia | 99.9 /100 | #60 | Exceptional $51,557 |
| Immigrants | Latvia | 99.9 /100 | #61 | Exceptional $51,555 |
| Immigrants | Romania | 99.9 /100 | #62 | Exceptional $51,337 |
| Immigrants | Bulgaria | 99.9 /100 | #63 | Exceptional $51,318 |
| New Zealanders | 99.9 /100 | #64 | Exceptional $51,246 |
| Greeks | 99.9 /100 | #65 | Exceptional $51,164 |
Demographics Similar to Tohono O'odham by Median Earnings
In terms of median earnings, the demographic groups most similar to Tohono O'odham are Arapaho ($36,586, a difference of 0.65%), Yup'ik ($35,942, a difference of 1.1%), Pueblo ($36,859, a difference of 1.4%), Hopi ($36,871, a difference of 1.4%), and Lumbee ($36,876, a difference of 1.5%).
| Demographics | Rating | Rank | Median Earnings |
| Houma | 0.0 /100 | #333 | Tragic $38,949 |
| Spanish American Indians | 0.0 /100 | #334 | Tragic $38,907 |
| Natives/Alaskans | 0.0 /100 | #335 | Tragic $38,896 |
| Crow | 0.0 /100 | #336 | Tragic $38,707 |
| Immigrants | Cuba | 0.0 /100 | #337 | Tragic $38,426 |
| Pima | 0.0 /100 | #338 | Tragic $38,285 |
| Menominee | 0.0 /100 | #339 | Tragic $37,884 |
| Navajo | 0.0 /100 | #340 | Tragic $36,999 |
| Lumbee | 0.0 /100 | #341 | Tragic $36,876 |
| Hopi | 0.0 /100 | #342 | Tragic $36,871 |
| Pueblo | 0.0 /100 | #343 | Tragic $36,859 |
| Arapaho | 0.0 /100 | #344 | Tragic $36,586 |
| Tohono O'odham | 0.0 /100 | #345 | Tragic $36,349 |
| Yup'ik | 0.0 /100 | #346 | Tragic $35,942 |
| Puerto Ricans | 0.0 /100 | #347 | Tragic $35,560 |