Immigrants from Belize vs Paiute 8th Grade
COMPARE
Immigrants from Belize
Paiute
8th Grade
8th Grade Comparison
Immigrants from Belize
Paiute
92.9%
8TH GRADE
0.0/ 100
METRIC RATING
323rd/ 347
METRIC RANK
95.1%
8TH GRADE
1.7/ 100
METRIC RATING
243rd/ 347
METRIC RANK
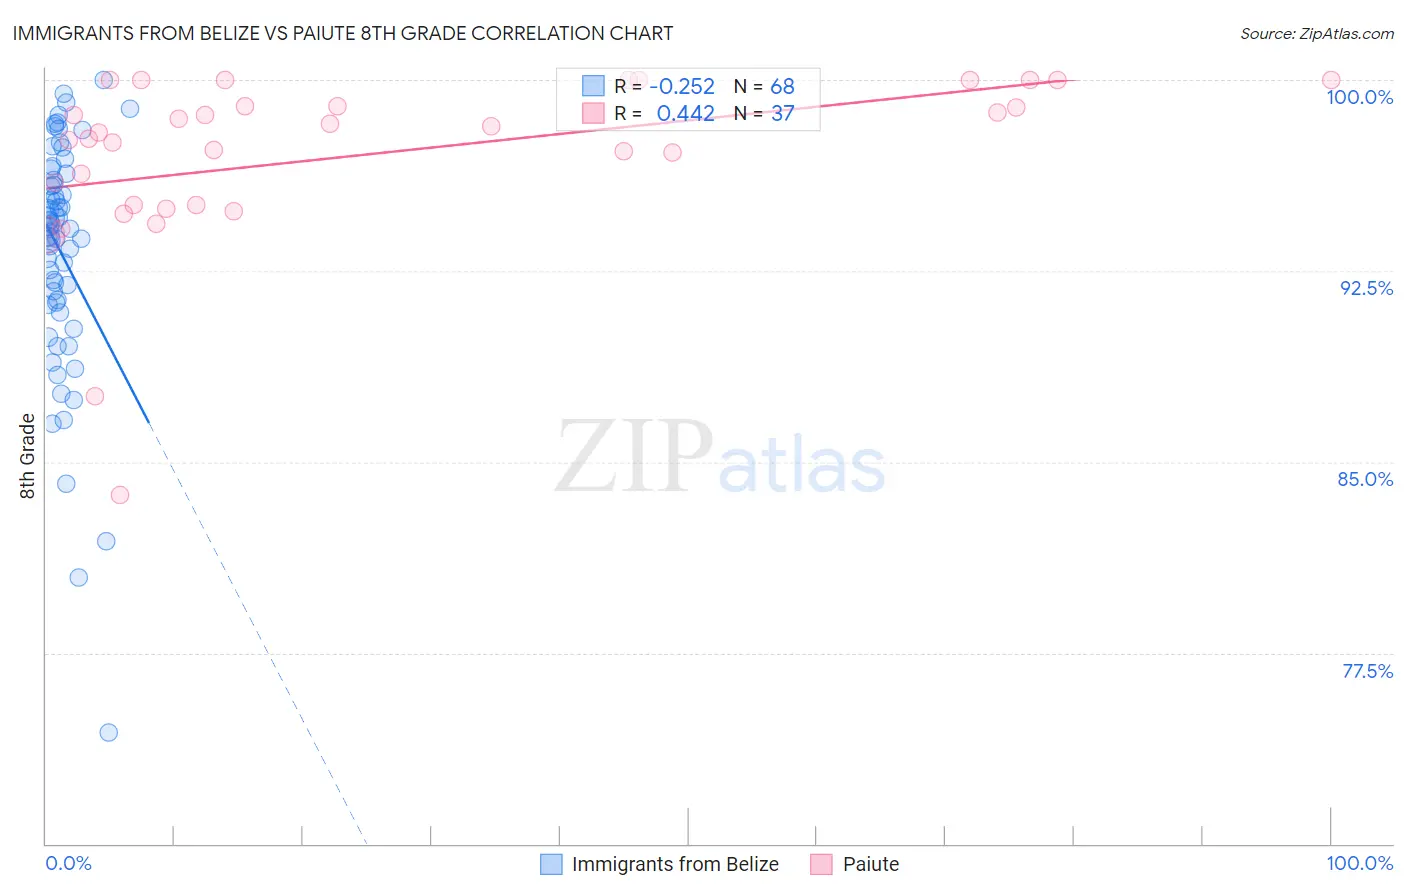
Immigrants from Belize vs Paiute 8th Grade Correlation Chart
The statistical analysis conducted on geographies consisting of 130,181,087 people shows a weak negative correlation between the proportion of Immigrants from Belize and percentage of population with at least 8th grade education in the United States with a correlation coefficient (R) of -0.252 and weighted average of 92.9%. Similarly, the statistical analysis conducted on geographies consisting of 58,403,520 people shows a moderate positive correlation between the proportion of Paiute and percentage of population with at least 8th grade education in the United States with a correlation coefficient (R) of 0.442 and weighted average of 95.1%, a difference of 2.4%.
8th Grade Correlation Summary
| Measurement | Immigrants from Belize | Paiute |
| Minimum | 74.3% | 83.7% |
| Maximum | 100.0% | 100.0% |
| Range | 25.7% | 16.3% |
| Mean | 93.2% | 97.1% |
| Median | 94.2% | 97.9% |
| Interquartile 25% (IQ1) | 91.2% | 95.1% |
| Interquartile 75% (IQ3) | 96.2% | 99.5% |
| Interquartile Range (IQR) | 5.0% | 4.4% |
| Standard Deviation (Sample) | 4.7% | 3.4% |
| Standard Deviation (Population) | 4.7% | 3.4% |
Similar Demographics by 8th Grade
Demographics Similar to Immigrants from Belize by 8th Grade
In terms of 8th grade, the demographic groups most similar to Immigrants from Belize are Nicaraguan (93.0%, a difference of 0.050%), Nepalese (92.8%, a difference of 0.070%), Dominican (92.8%, a difference of 0.16%), Belizean (93.1%, a difference of 0.17%), and Central American Indian (92.7%, a difference of 0.21%).
| Demographics | Rating | Rank | 8th Grade |
| Immigrants | Cambodia | 0.0 /100 | #316 | Tragic 93.3% |
| Immigrants | Ecuador | 0.0 /100 | #317 | Tragic 93.3% |
| Puerto Ricans | 0.0 /100 | #318 | Tragic 93.2% |
| Immigrants | Cuba | 0.0 /100 | #319 | Tragic 93.2% |
| Immigrants | Fiji | 0.0 /100 | #320 | Tragic 93.2% |
| Belizeans | 0.0 /100 | #321 | Tragic 93.1% |
| Nicaraguans | 0.0 /100 | #322 | Tragic 93.0% |
| Immigrants | Belize | 0.0 /100 | #323 | Tragic 92.9% |
| Nepalese | 0.0 /100 | #324 | Tragic 92.8% |
| Dominicans | 0.0 /100 | #325 | Tragic 92.8% |
| Central American Indians | 0.0 /100 | #326 | Tragic 92.7% |
| Immigrants | Azores | 0.0 /100 | #327 | Tragic 92.5% |
| Immigrants | Nicaragua | 0.0 /100 | #328 | Tragic 92.5% |
| Immigrants | Cabo Verde | 0.0 /100 | #329 | Tragic 92.4% |
| Immigrants | Armenia | 0.0 /100 | #330 | Tragic 92.3% |
Demographics Similar to Paiute by 8th Grade
In terms of 8th grade, the demographic groups most similar to Paiute are Tongan (95.1%, a difference of 0.0%), Immigrants from Middle Africa (95.1%, a difference of 0.0%), South American Indian (95.1%, a difference of 0.020%), Immigrants from Sierra Leone (95.1%, a difference of 0.030%), and Ethiopian (95.1%, a difference of 0.030%).
| Demographics | Rating | Rank | 8th Grade |
| Senegalese | 2.7 /100 | #236 | Tragic 95.2% |
| Immigrants | Africa | 2.7 /100 | #237 | Tragic 95.2% |
| Natives/Alaskans | 2.3 /100 | #238 | Tragic 95.2% |
| Immigrants | Sierra Leone | 2.1 /100 | #239 | Tragic 95.1% |
| Ethiopians | 2.0 /100 | #240 | Tragic 95.1% |
| South American Indians | 1.9 /100 | #241 | Tragic 95.1% |
| Tongans | 1.7 /100 | #242 | Tragic 95.1% |
| Paiute | 1.7 /100 | #243 | Tragic 95.1% |
| Immigrants | Middle Africa | 1.7 /100 | #244 | Tragic 95.1% |
| Jamaicans | 1.4 /100 | #245 | Tragic 95.1% |
| Somalis | 1.4 /100 | #246 | Tragic 95.1% |
| Immigrants | Senegal | 1.4 /100 | #247 | Tragic 95.1% |
| Uruguayans | 1.2 /100 | #248 | Tragic 95.1% |
| Immigrants | China | 1.1 /100 | #249 | Tragic 95.0% |
| Koreans | 1.1 /100 | #250 | Tragic 95.0% |