Immigrants from Belize vs Yugoslavian 8th Grade
COMPARE
Immigrants from Belize
Yugoslavian
8th Grade
8th Grade Comparison
Immigrants from Belize
Yugoslavians
92.9%
8TH GRADE
0.0/ 100
METRIC RATING
323rd/ 347
METRIC RANK
96.5%
8TH GRADE
99.4/ 100
METRIC RATING
78th/ 347
METRIC RANK
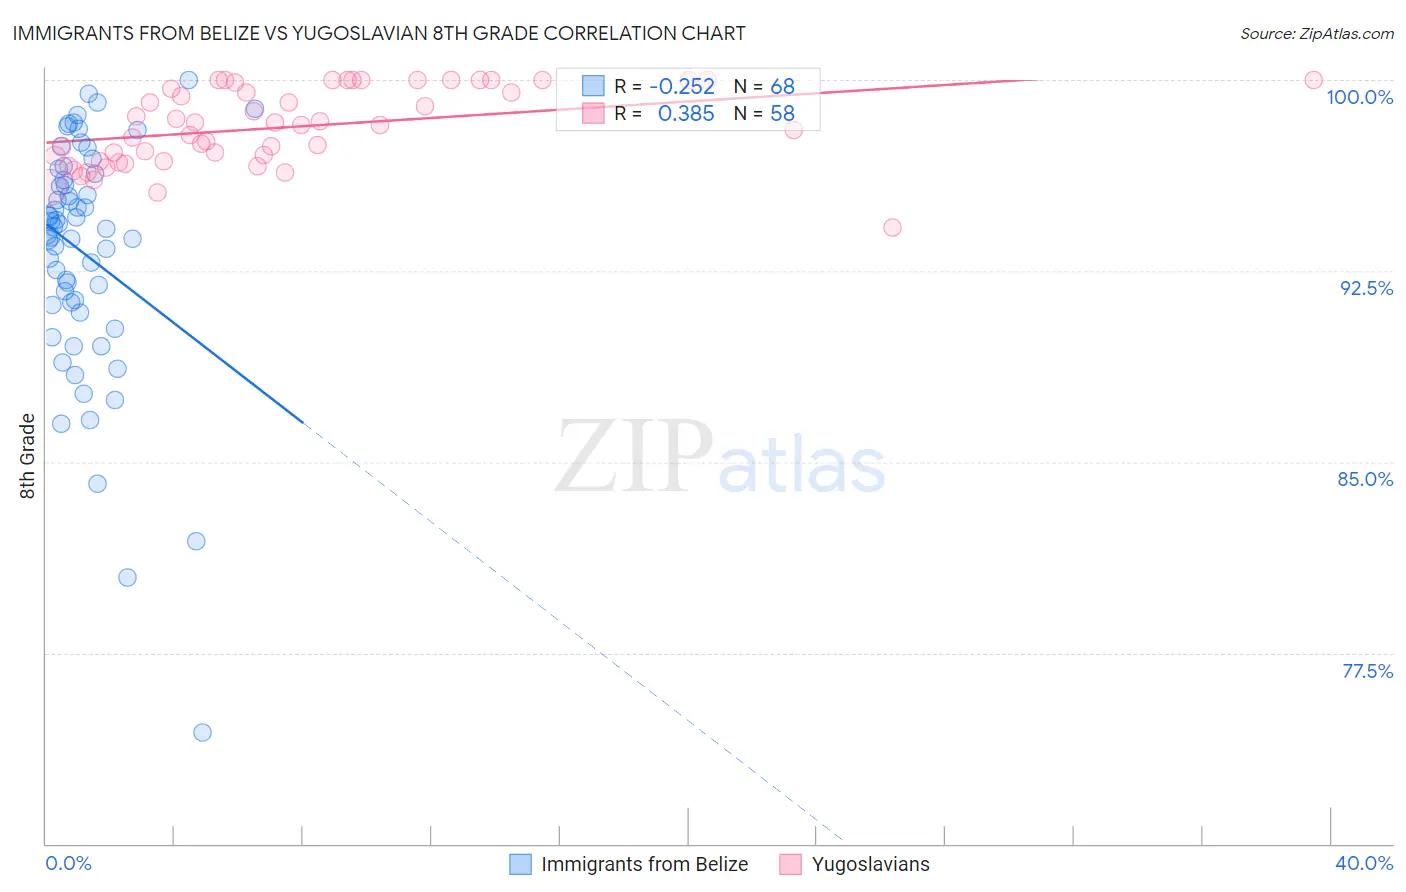
Immigrants from Belize vs Yugoslavian 8th Grade Correlation Chart
The statistical analysis conducted on geographies consisting of 130,181,087 people shows a weak negative correlation between the proportion of Immigrants from Belize and percentage of population with at least 8th grade education in the United States with a correlation coefficient (R) of -0.252 and weighted average of 92.9%. Similarly, the statistical analysis conducted on geographies consisting of 285,618,157 people shows a mild positive correlation between the proportion of Yugoslavians and percentage of population with at least 8th grade education in the United States with a correlation coefficient (R) of 0.385 and weighted average of 96.5%, a difference of 3.9%.
8th Grade Correlation Summary
| Measurement | Immigrants from Belize | Yugoslavian |
| Minimum | 74.3% | 94.2% |
| Maximum | 100.0% | 100.0% |
| Range | 25.7% | 5.8% |
| Mean | 93.2% | 98.2% |
| Median | 94.2% | 98.2% |
| Interquartile 25% (IQ1) | 91.2% | 96.8% |
| Interquartile 75% (IQ3) | 96.2% | 99.9% |
| Interquartile Range (IQR) | 5.0% | 3.1% |
| Standard Deviation (Sample) | 4.7% | 1.5% |
| Standard Deviation (Population) | 4.7% | 1.5% |
Similar Demographics by 8th Grade
Demographics Similar to Immigrants from Belize by 8th Grade
In terms of 8th grade, the demographic groups most similar to Immigrants from Belize are Nicaraguan (93.0%, a difference of 0.050%), Nepalese (92.8%, a difference of 0.070%), Dominican (92.8%, a difference of 0.16%), Belizean (93.1%, a difference of 0.17%), and Central American Indian (92.7%, a difference of 0.21%).
| Demographics | Rating | Rank | 8th Grade |
| Immigrants | Cambodia | 0.0 /100 | #316 | Tragic 93.3% |
| Immigrants | Ecuador | 0.0 /100 | #317 | Tragic 93.3% |
| Puerto Ricans | 0.0 /100 | #318 | Tragic 93.2% |
| Immigrants | Cuba | 0.0 /100 | #319 | Tragic 93.2% |
| Immigrants | Fiji | 0.0 /100 | #320 | Tragic 93.2% |
| Belizeans | 0.0 /100 | #321 | Tragic 93.1% |
| Nicaraguans | 0.0 /100 | #322 | Tragic 93.0% |
| Immigrants | Belize | 0.0 /100 | #323 | Tragic 92.9% |
| Nepalese | 0.0 /100 | #324 | Tragic 92.8% |
| Dominicans | 0.0 /100 | #325 | Tragic 92.8% |
| Central American Indians | 0.0 /100 | #326 | Tragic 92.7% |
| Immigrants | Azores | 0.0 /100 | #327 | Tragic 92.5% |
| Immigrants | Nicaragua | 0.0 /100 | #328 | Tragic 92.5% |
| Immigrants | Cabo Verde | 0.0 /100 | #329 | Tragic 92.4% |
| Immigrants | Armenia | 0.0 /100 | #330 | Tragic 92.3% |
Demographics Similar to Yugoslavians by 8th Grade
In terms of 8th grade, the demographic groups most similar to Yugoslavians are Cypriot (96.5%, a difference of 0.0%), Zimbabwean (96.5%, a difference of 0.010%), Immigrants from Netherlands (96.5%, a difference of 0.010%), Immigrants from Ireland (96.5%, a difference of 0.020%), and Puget Sound Salish (96.5%, a difference of 0.020%).
| Demographics | Rating | Rank | 8th Grade |
| New Zealanders | 99.5 /100 | #71 | Exceptional 96.6% |
| Immigrants | England | 99.5 /100 | #72 | Exceptional 96.6% |
| Arapaho | 99.5 /100 | #73 | Exceptional 96.6% |
| Immigrants | Ireland | 99.5 /100 | #74 | Exceptional 96.5% |
| Zimbabweans | 99.4 /100 | #75 | Exceptional 96.5% |
| Immigrants | Netherlands | 99.4 /100 | #76 | Exceptional 96.5% |
| Cypriots | 99.4 /100 | #77 | Exceptional 96.5% |
| Yugoslavians | 99.4 /100 | #78 | Exceptional 96.5% |
| Puget Sound Salish | 99.3 /100 | #79 | Exceptional 96.5% |
| Delaware | 99.2 /100 | #80 | Exceptional 96.5% |
| Romanians | 99.2 /100 | #81 | Exceptional 96.5% |
| Turks | 99.2 /100 | #82 | Exceptional 96.5% |
| Icelanders | 99.2 /100 | #83 | Exceptional 96.5% |
| Immigrants | Belgium | 99.1 /100 | #84 | Exceptional 96.5% |
| Immigrants | South Africa | 99.1 /100 | #85 | Exceptional 96.5% |