Immigrants from Belize vs Bermudan 8th Grade
COMPARE
Immigrants from Belize
Bermudan
8th Grade
8th Grade Comparison
Immigrants from Belize
Bermudans
92.9%
8TH GRADE
0.0/ 100
METRIC RATING
323rd/ 347
METRIC RANK
95.8%
8TH GRADE
67.5/ 100
METRIC RATING
161st/ 347
METRIC RANK
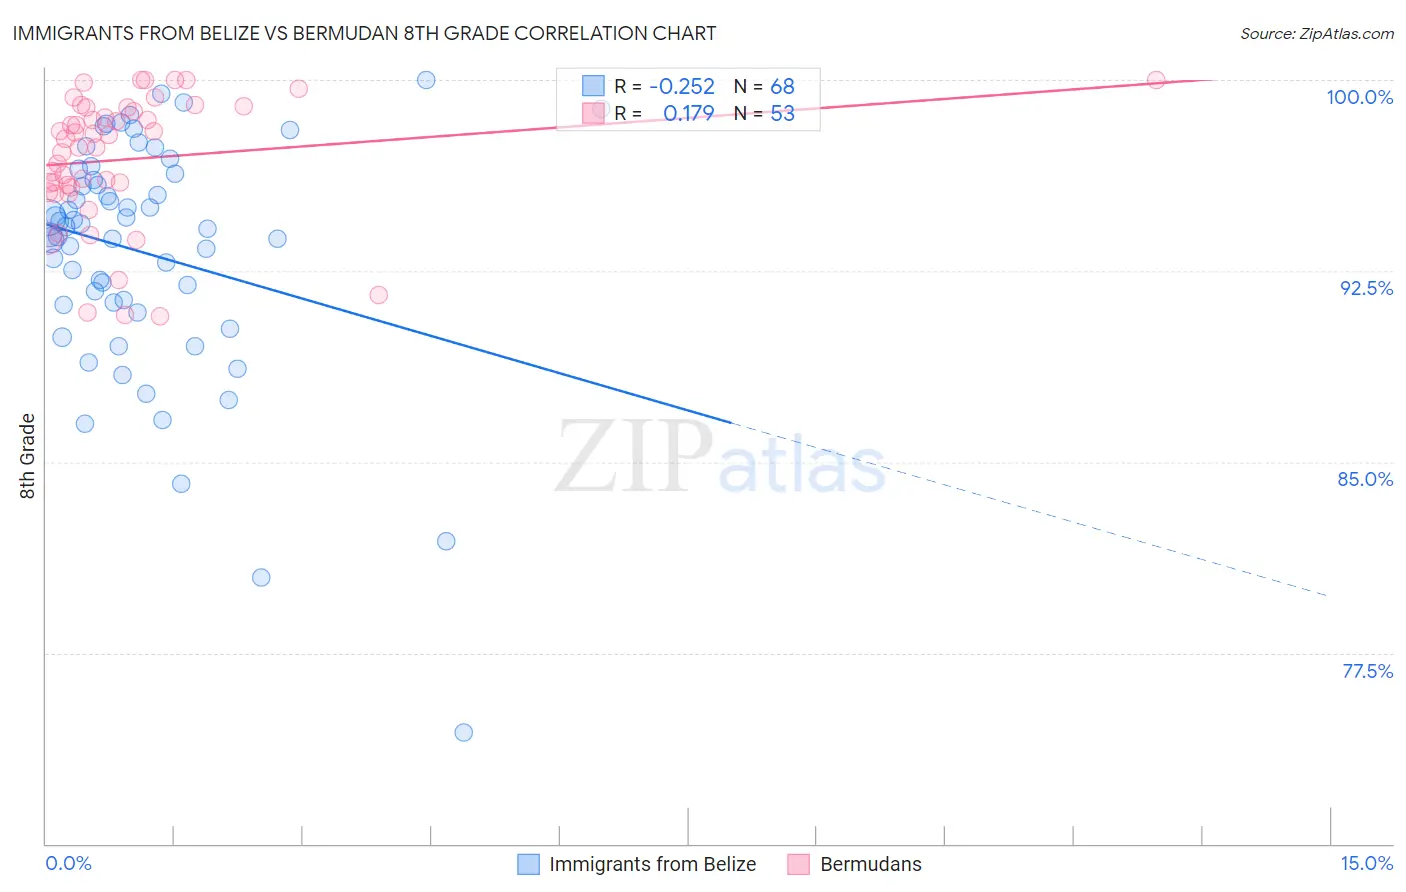
Immigrants from Belize vs Bermudan 8th Grade Correlation Chart
The statistical analysis conducted on geographies consisting of 130,181,087 people shows a weak negative correlation between the proportion of Immigrants from Belize and percentage of population with at least 8th grade education in the United States with a correlation coefficient (R) of -0.252 and weighted average of 92.9%. Similarly, the statistical analysis conducted on geographies consisting of 55,732,793 people shows a poor positive correlation between the proportion of Bermudans and percentage of population with at least 8th grade education in the United States with a correlation coefficient (R) of 0.179 and weighted average of 95.8%, a difference of 3.2%.
8th Grade Correlation Summary
| Measurement | Immigrants from Belize | Bermudan |
| Minimum | 74.3% | 90.7% |
| Maximum | 100.0% | 100.0% |
| Range | 25.7% | 9.3% |
| Mean | 93.2% | 96.9% |
| Median | 94.2% | 97.7% |
| Interquartile 25% (IQ1) | 91.2% | 95.7% |
| Interquartile 75% (IQ3) | 96.2% | 98.9% |
| Interquartile Range (IQR) | 5.0% | 3.2% |
| Standard Deviation (Sample) | 4.7% | 2.5% |
| Standard Deviation (Population) | 4.7% | 2.5% |
Similar Demographics by 8th Grade
Demographics Similar to Immigrants from Belize by 8th Grade
In terms of 8th grade, the demographic groups most similar to Immigrants from Belize are Nicaraguan (93.0%, a difference of 0.050%), Nepalese (92.8%, a difference of 0.070%), Dominican (92.8%, a difference of 0.16%), Belizean (93.1%, a difference of 0.17%), and Central American Indian (92.7%, a difference of 0.21%).
| Demographics | Rating | Rank | 8th Grade |
| Immigrants | Cambodia | 0.0 /100 | #316 | Tragic 93.3% |
| Immigrants | Ecuador | 0.0 /100 | #317 | Tragic 93.3% |
| Puerto Ricans | 0.0 /100 | #318 | Tragic 93.2% |
| Immigrants | Cuba | 0.0 /100 | #319 | Tragic 93.2% |
| Immigrants | Fiji | 0.0 /100 | #320 | Tragic 93.2% |
| Belizeans | 0.0 /100 | #321 | Tragic 93.1% |
| Nicaraguans | 0.0 /100 | #322 | Tragic 93.0% |
| Immigrants | Belize | 0.0 /100 | #323 | Tragic 92.9% |
| Nepalese | 0.0 /100 | #324 | Tragic 92.8% |
| Dominicans | 0.0 /100 | #325 | Tragic 92.8% |
| Central American Indians | 0.0 /100 | #326 | Tragic 92.7% |
| Immigrants | Azores | 0.0 /100 | #327 | Tragic 92.5% |
| Immigrants | Nicaragua | 0.0 /100 | #328 | Tragic 92.5% |
| Immigrants | Cabo Verde | 0.0 /100 | #329 | Tragic 92.4% |
| Immigrants | Armenia | 0.0 /100 | #330 | Tragic 92.3% |
Demographics Similar to Bermudans by 8th Grade
In terms of 8th grade, the demographic groups most similar to Bermudans are Seminole (95.8%, a difference of 0.0%), Immigrants from Kenya (95.8%, a difference of 0.0%), Arab (95.9%, a difference of 0.010%), Immigrants from Kazakhstan (95.9%, a difference of 0.010%), and Immigrants from Taiwan (95.9%, a difference of 0.020%).
| Demographics | Rating | Rank | 8th Grade |
| Hopi | 79.4 /100 | #154 | Good 95.9% |
| Kenyans | 74.5 /100 | #155 | Good 95.9% |
| Ugandans | 74.1 /100 | #156 | Good 95.9% |
| Immigrants | Taiwan | 70.5 /100 | #157 | Good 95.9% |
| Arabs | 69.4 /100 | #158 | Good 95.9% |
| Immigrants | Kazakhstan | 68.4 /100 | #159 | Good 95.9% |
| Seminole | 67.7 /100 | #160 | Good 95.8% |
| Bermudans | 67.5 /100 | #161 | Good 95.8% |
| Immigrants | Kenya | 67.2 /100 | #162 | Good 95.8% |
| Immigrants | Sri Lanka | 64.1 /100 | #163 | Good 95.8% |
| Immigrants | Italy | 63.5 /100 | #164 | Good 95.8% |
| Alsatians | 61.4 /100 | #165 | Good 95.8% |
| Immigrants | Poland | 61.1 /100 | #166 | Good 95.8% |
| Spaniards | 60.0 /100 | #167 | Good 95.8% |
| Immigrants | Ukraine | 59.5 /100 | #168 | Average 95.8% |